Home Features Use Cases Pricing Docs Try the Demo
Use Case — FP&A Command Center

Run your firm the way
the large firms do.

Large GovCon firms have dedicated FP&A teams, pricing departments, and analysts whose only job is turning ERP data into decisions. Firms under $100M make the same bets—on contracts, on hires, on capital—without any of that infrastructure. Arcvue closes that gap without the headcount.

The Problem

Your data is in the ERP. Your decisions aren't informed by it.

The ERP closes the books. It records time, tracks costs, processes invoices. What it doesn't do is give you a view of the business you can actually run it from. Getting your P&L by division, your current indirect rates, your 13-week cash position, your pipeline coverage ratios—each of those requires asking someone who has three other jobs, waiting for them to pull the data, and receiving it in a format designed for accounting, not for decisions.

By the time you have the number, it's already stale. By the time you've reconciled it with the forecast, another week has passed. The decisions still get made—they just get made without the analytical foundation that would make them better. Most GovCon CEOs and CFOs are running their firms substantially on pattern recognition and gut feel, not because they prefer it that way, but because building the infrastructure to do otherwise would require people and systems they don't have.

The $300M firms don't have better instincts. They have better data, available faster, organized for action. That's a structural advantage that compounds every quarter—in the bids they price more accurately, the contracts they catch before margin erodes, the capital decisions they make with real cash flow projections instead of estimates. Arcvue gives that infrastructure to every firm, regardless of size.

Outcome 1

Stop waiting for your own numbers.

"I need the Q1 P&L by division. Can someone pull that together by end of week?"

That question—and the week it takes to answer it—goes away entirely. Arcvue syncs your ERP nightly. Your income statement, balance sheet, indirect rates, and financial summaries are available every morning by company and by division, without anyone pulling anything. The person who used to spend time on that is now doing something more valuable.

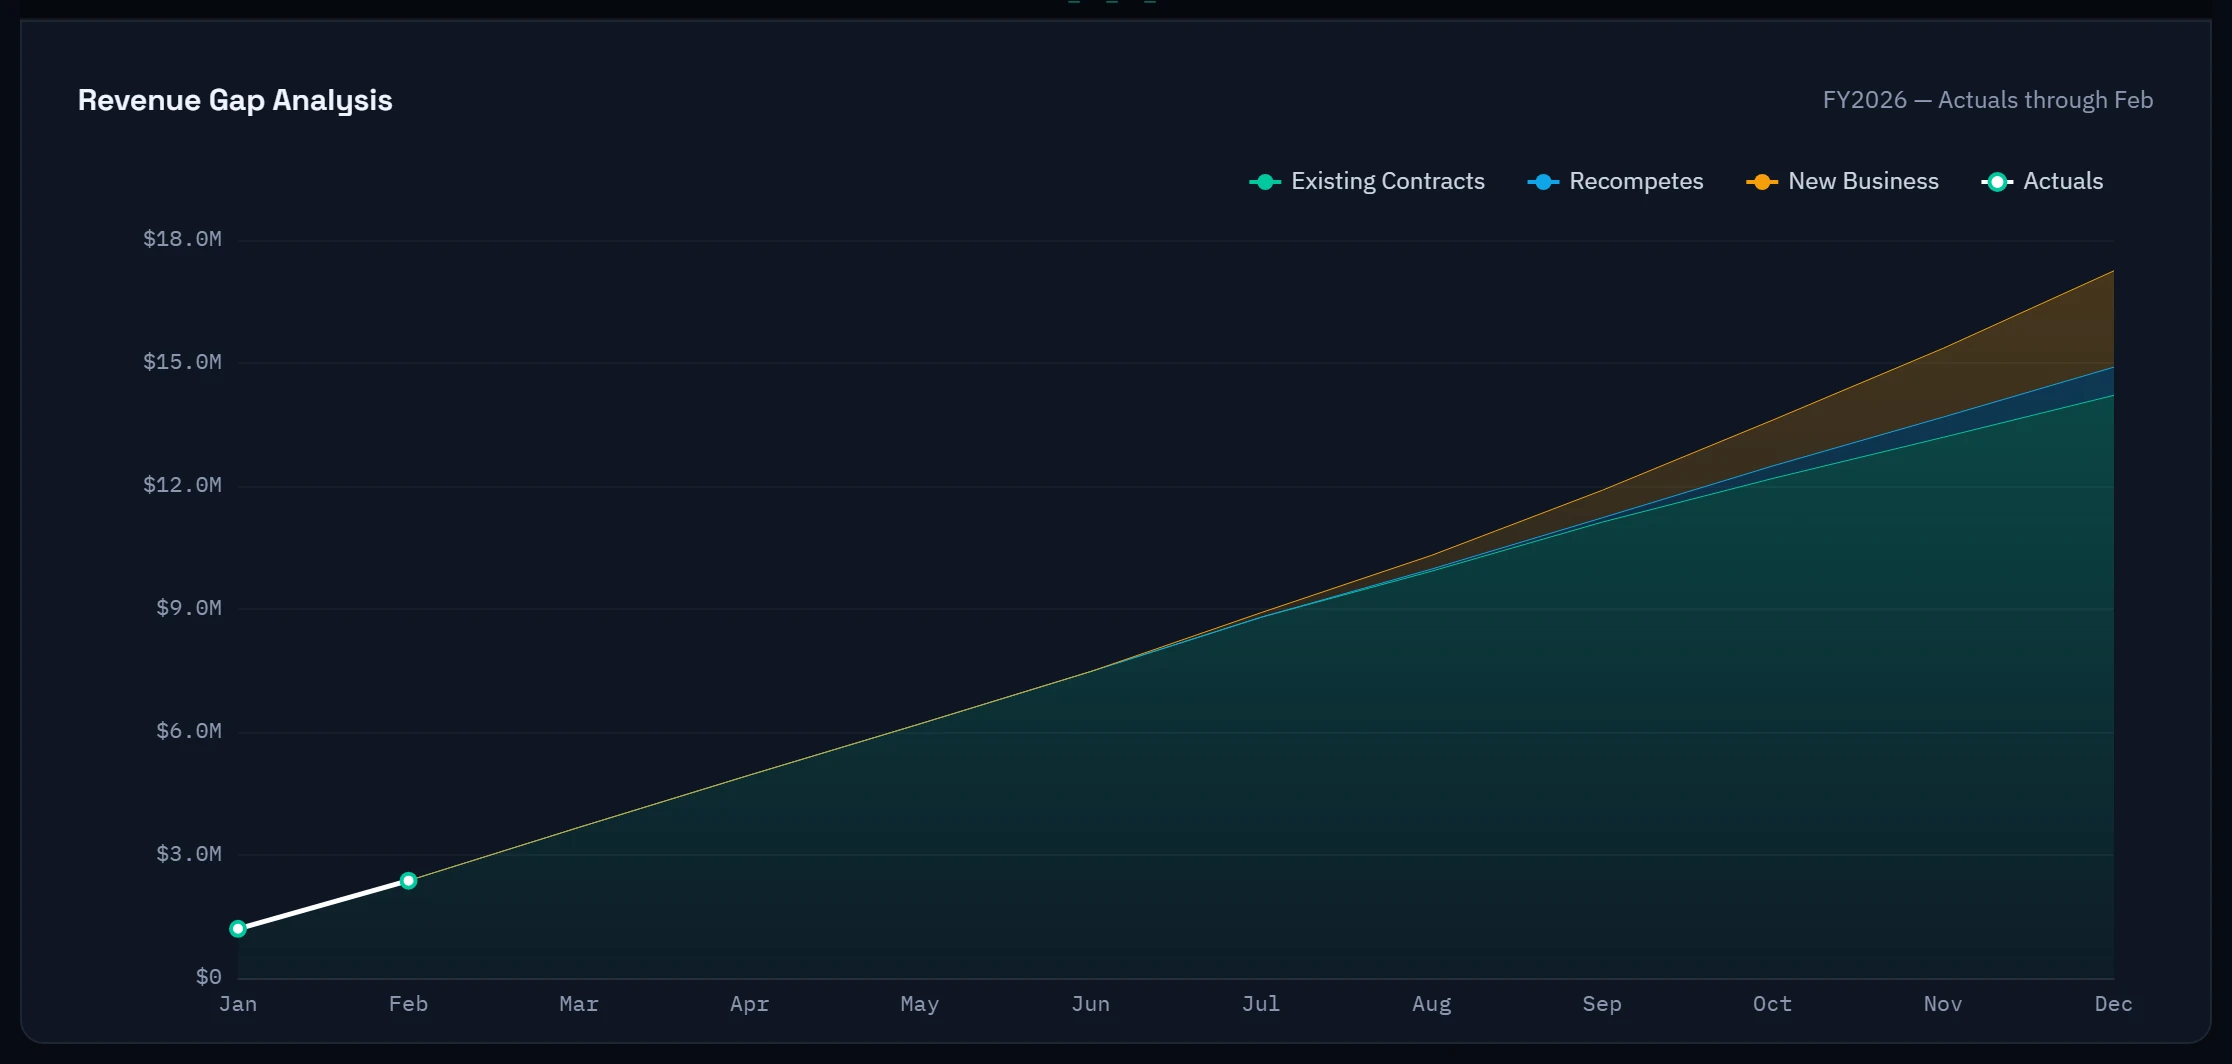
Actuals for closed months come directly from ERP transactions. Open months roll forward using your current forecast. The two combine automatically so the view is always current—not just through the last close, and not just a projection from the start of the year. Every number is traceable to its source: an ERP transaction for actuals, a division lead's forecast entry for open months.

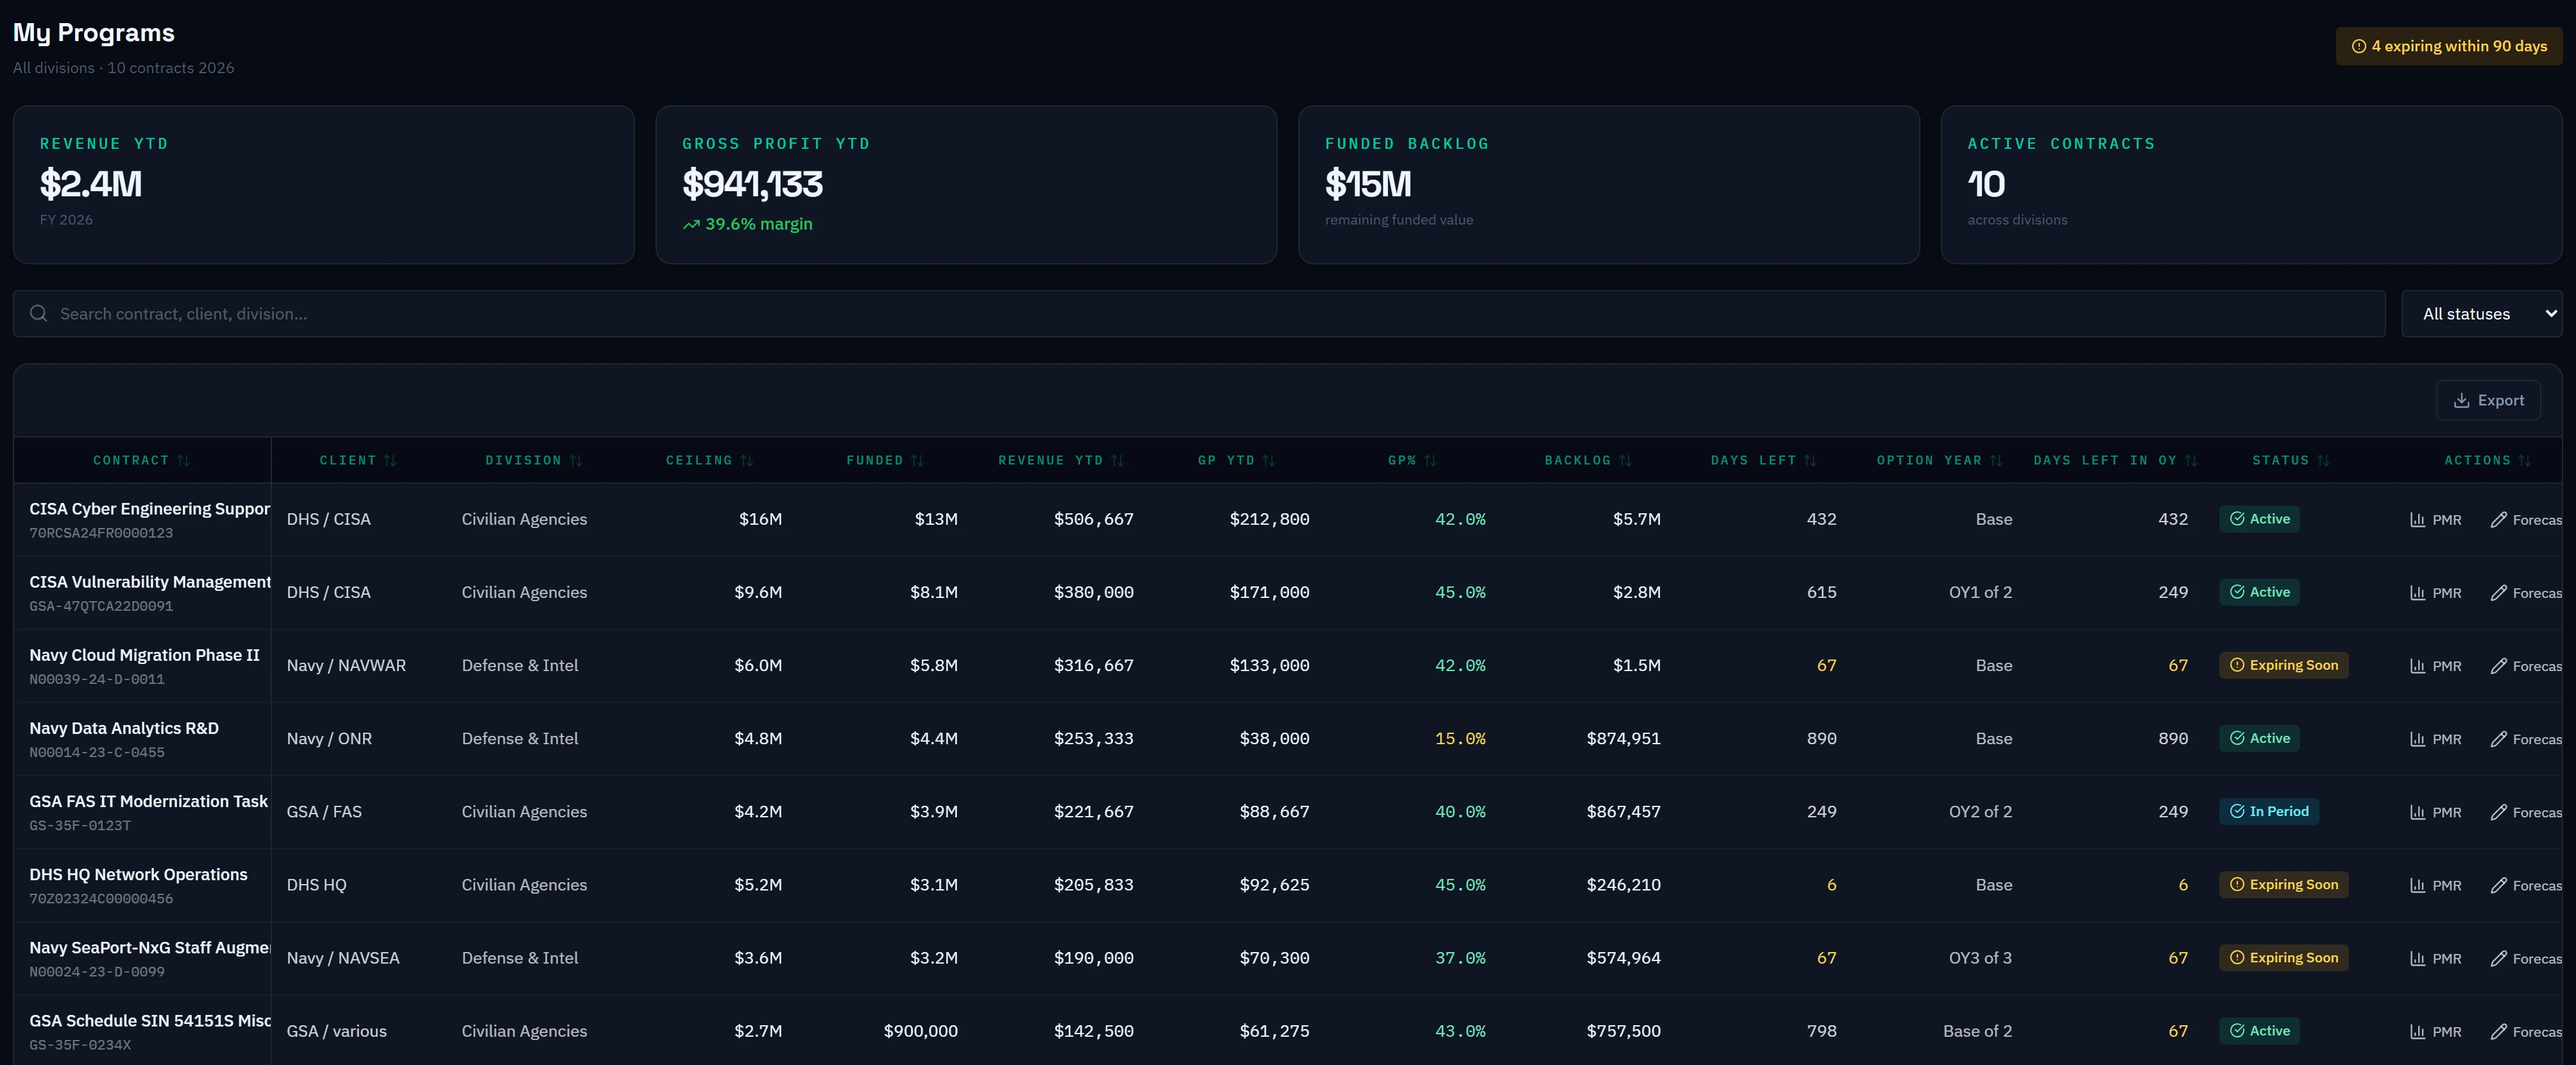
Division leads see their own performance nightly—revenue, costs, gross profit, margin, and burn rate by contract—without requesting a report. Problems surface before the quarterly program management review, not during it. Margin erosion on a specific contract shows up the morning after it starts, not three months later when it's already cost you a quarter's profit.

Arcvue — CEO Dashboard · This Morning
FY26 Revenue (A+F)
$35.4M
↑ $2.1M vs FY25
Adj. EBITDA
$5.7M
16.1% margin
DivisionRevenueGP%vs Budget
Federal Health$16.8M45.4%+2.1%
Defense & Intel$12.4M49.0%+0.8%
Civilian$9.2M38.2%−3.4%
⚠ Civilian division GP% tracking 3.4 pts below budget. NAVAIR Fleet Ops margin at 14.7%—review flagged.
Outcome 2

Model the decision before you make it.

"If we lose the MEDCOM recompete, what does that do to our cash? Do we need to draw on the line? Will we breach our leverage covenant?"

That question has an answer in Arcvue within minutes. Contract loss, headcount change, new award, rate adjustment—any business event can be modeled against your actual P&L, balance sheet, and debt schedule. The three-statement impact cascades automatically: lower revenue drives lower EBITDA, which reduces operating cash, which changes your LOC draw behavior, which affects leverage and DSCR. Every downstream consequence is visible before the event happens.

This is the capability that separates firms that make confident decisions from firms that make the same decisions but with their fingers crossed. It's not that one group has better judgment—it's that one group can see around corners. When the recompete is awarded, you already know your financial posture under every outcome. When the bank calls about covenant compliance, you've been tracking it nightly. When a hiring decision comes up, you know exactly what a new position does to your fringe rate and your cash position in the months it takes to get that person billable.

Three scenarios run simultaneously—base, upside, and downside—against your actual debt structure and covenant thresholds. The side-by-side comparison tells you not just what might happen, but what you need to do differently under each outcome. That's the CFO function most GovCon firms can't afford to hire. It's built into the platform.

Arcvue — Scenario · MEDCOM Recompete
ImpactWinLosePartial
Revenue$35.4M$32.3M$34.0M
Adj. EBITDA$5.7M$3.9M$4.8M
DSCR1.48x1.01x ✕1.24x ⚠
LOC Draw$4.8M$5.8M$5.2M
COVENANT BREACH — LOSE SCENARIO
DSCR 1.01x breaches 1.20x minimum. Lender conversation required if loss confirmed.
Outcome 3

Price every bid on your actual cost structure—not last quarter's estimate.

"We keep losing on price but we don't know if we're too expensive or underestimating our costs. We also don't know what the incumbent is actually billing."

Both questions have answers. Arcvue computes your indirect rates nightly from actual ERP cost pools—the fringe, overhead, and G&A rates your proposals use are current by definition, not carried over from a model that gets updated once a year. Every proposal prices from your real cost structure. The gap between what you bid and what it costs to deliver closes to nearly zero.

GSA CALC+ market intelligence shows where your rates sit relative to competitors billing similar labor categories on contracts like yours. It's a validation check against the pricing you've built from cost—not a substitute for cost-based pricing, but a sanity check that tells you whether you're competitive before you submit. Incumbent rates pulled from USAspending.gov let you look up what the current contractor is billing on any predecessor contract, position by position. On a recompete, that's the most important number in the file.

Win/loss history accumulates over every bid. Over time you see which agencies you win consistently, which vehicle types produce the best outcomes, and where your pricing is above market versus where it's competitive. That intelligence compounds. Each bid you submit improves the dataset for the next one. The CGO who has run thirty bids through Arcvue has a fundamentally different competitive picture than one who's running each bid from a standing start.

Arcvue — Pricing · Market Position
Wrap Rate (live)
1.78x
From last night's ERP sync
Market Position
P18
Below median — competitive
LCATYour RateMarket P50Incumbent
Sr. Cloud Architect$142.80$155.40$79.02
Business Analyst II$98.40$104.20$92.40
INCUMBENT · USAspending.gov
Cherokee Nation M&C on predecessor contract. Sr. Cloud Admin at $79.02 — significant gap vs your $142.80. Same labor category?
Outcome 4

Annual budgeting in days, not weeks. Real-time forecasting all year.

"We send out the Excel templates in November, chase division leads until December, reconcile inconsistencies manually, and enter everything into the system by hand. Then we do it again in March when half of it is already wrong."

That cycle ends. Division leads and PMs log into Arcvue, see their contracts with full historical actuals as context, enter their forecasts against the right numbers, and submit. Finance sees every submission in real time, reviews in the platform, and approves with one click. Approved forecasts roll up to the company P&L automatically—no reconciliation, no reentry, no version control. The budget cycle that consumed six weeks of finance's time happens in days.

The budget doesn't become stale the moment it's finished. Nightly ERP syncs bring in actual data as months close. The forecast updates continuously as PMs revise their projections based on actual performance. What you have isn't an annual budget that you compare reality against once a quarter—it's a living forecast that's always current, always reconciled to actuals, and always available at the division and contract level without asking anyone to pull it together.

For firms that need to load the approved budget into the ERP, the platform exports the full financial and project budget in ERP-ready format. One export, structured correctly, no reformatting. After that, the platform stays open for real-time forecasting throughout the year—the two processes connect rather than competing.

Arcvue — Budget Submission Status
Submitted
38
of 47 contracts
Approved
31
Rolling up live
Pending
9
Reminders sent
DivisionSubmittedApprovedStatus
Federal Health14/1414/14● Complete
Defense & Intel12/1210/12● In Review
Civilian12/157/15● In Progress
Outcome 5

Know your cash position before the bank asks.

"We run on accrual. Our controller tells us we're profitable. But the bank balance doesn't match, the LOC is drawn more than it should be, and I don't have a clear picture of what the next 90 days look like."

The gap between accrual profitability and cash reality is one of the most common sources of anxiety for GovCon CEOs. You can have a profitable P&L and a stressed cash position simultaneously—because government payment cycles are long, payroll goes out every two weeks, and the LOC behavior that looks fine on a monthly basis creates intramonth stress you never see in the financials.

Arcvue generates a 13-week cash forecast from your actual AR collection patterns, payroll cadence, vendor payment behavior, LOC draw history, and debt service schedule. Enter your bank balance today and the platform anchors the full picture around it—eight weeks back showing how you got to your current balance, thirteen weeks forward showing where you're going. The forecast updates nightly as real transactions flow in. The variables that matter—a large invoice clearing, a payroll week that falls at the end of a month, a revolver approaching its limit—surface as they develop, not after they've already created a problem.

Covenant compliance is computed nightly from actual ERP data. DSCR and leverage are always current. When the bank calls for the quarterly covenant certification, you've already been reviewing the numbers every morning. There are no surprises, no scramble to build a model the night before. The answer is ready because it's been ready every day.

Arcvue — Treasury · 13-Week Forecast
Bank Balance Today
$1.2M
Anchored from entry
LOC Available
$1.2M
80% drawn
Cash · 8 weeks back · 13 weeks forward
Week 11: Large payroll cycle + two invoices outstanding. Cash dips to $180K. LOC draw likely. Flag before it happens.
Outcome 6

Know whether you have enough pipeline to hit your number—before you're behind.

"We think we have a strong pipeline. But when I ask how much coverage we have against the FY27 growth target by division, nobody has the answer."

Pipeline coverage is one of the most important operational metrics for any GovCon firm and one of the least rigorously measured. A firm that says it has a "healthy pipeline" without being able to quantify coverage by division and year against actual growth targets is flying blind on its most important growth variable.

Arcvue computes coverage ratios by division and by year against the growth assumptions in your contract waterfall. Federal Health needs $4.2M in new contract wins in FY27. The platform tells you how much unweighted pipeline exists in that division for that year and what the ratio is. The coverage numbers are unweighted—because in GovCon, a 40% PWIN opportunity either wins or doesn't. A weighted pipeline gives a false sense of precision that the actual binary outcome doesn't support.

Low coverage in a specific division and year surfaces early enough to redirect BD resources, adjust the growth target, or accelerate pursuit on specific opportunities. High coverage in one division doesn't mask low coverage in another. The conversation with your board or your PE sponsor becomes grounded in data instead of narrative—and the difference between those two kinds of conversations is significant when something goes wrong.

Arcvue — Pipeline Coverage by Division
DivisionTargetFY26FY27FY28
Federal Health$4.2M4.2:13.8:12.9:1
Defense & Intel$3.8M8.7:119.4:118.7:1
Civilian$5.2M2.0:16.5:16.3:1
Civilian FY26 coverage at 2.0:1 — thin. Federal Health FY28 at 2.9:1 — watch list. Redirect BD resources now, not at year-end.

See your firm the way the large firms see theirs.

Connect your ERP and walk through a live demo. Your contracts, your rates, your pipeline—all of it, in under 90 minutes.

Try the Demo