Home Features Use Cases Pricing Docs Try the Demo
Features — Forecasting & Planning

Forward-looking.
From actual data.

Annual budgeting in most GovCon firms is a spreadsheet template emailed to division leads who fill in their best guesses without historical context. Arcvue replaces that process with a structured, system-driven workflow where every input is made against real contract history and every output rolls up automatically.

5
Forecast methods—manual, actuals-based, staffing calculator, T&M, and fixed price—selectable per contract
3
Simultaneous scenarios—base, upside, and downside—running against your actual debt structure and covenant thresholds
Full horizon
Contract waterfall decomposed year by year—active base, recompetes, and new growth—out to the end of your forecast window
Contract Forecasting

Division leads enter forecasts. The company rollup builds itself.

The people closest to each contract—program managers and division leads—know more about what it will produce than anyone assembling numbers from the outside. The question is how you get their inputs without the spreadsheet chaos that process normally creates.

Here is how most firms do it today. Finance sends Excel files to every division lead and PM. Each person forecasts their programs independently, with no visibility into what anyone else is entering and no access to historical actuals as context. They send the files back. Finance consolidates them by hand—reconciling differences in format, flagging missing submissions, chasing people who haven't responded. The consolidated result gets entered into the budgeting system manually. The whole cycle takes weeks, produces a budget nobody fully trusts, and has to be repeated whenever assumptions change.

Arcvue replaces that entire cycle. Division leads and PMs log into the platform, see their contracts with full historical actuals as context, enter their forecasts directly, and hit submit. Finance sees every submission in real time, reviews them in the platform, and approves with one click. Approved forecasts feed the company forecast automatically—no manual consolidation, no reentry. When a PM changes a number, the company P&L updates immediately. The budget cycle that used to take weeks happens in days. And unlike the Excel process, it stays current throughout the year—not just at annual budget time.

For firms that need to load an approved budget into the ERP, Arcvue exports the full financial and project budget to Excel in a format ready for ERP entry. One export, structured the way the ERP expects it. After that, the platform opens for real-time forecasting throughout the year—monthly actuals flow in from the ERP nightly, forecasts update as conditions change, and the company always has a current view without another consolidation cycle.

Five forecast methods are available, selectable per contract based on how that contract actually works. Manual entry for contracts where a PM has specific knowledge about upcoming months. Actuals-based copy for contracts running at a stable rate where prior performance is the best predictor. The staffing calculator for T&M and labor-hour contracts where the forecast is built from headcount, position mix, and billing rates—using your live indirect rates, not a static model. Fixed-price methods for firm-fixed-price contracts where revenue recognition follows a delivery or milestone schedule.

Forecasts can be locked at the month level. When a division lead finalizes January and doesn't want the engine to overwrite it during recompute, they lock it. Locked months are preserved through every subsequent rollup and rate update. Finance can lock periods across the entire portfolio at close to prevent retroactive changes to finalized actuals.

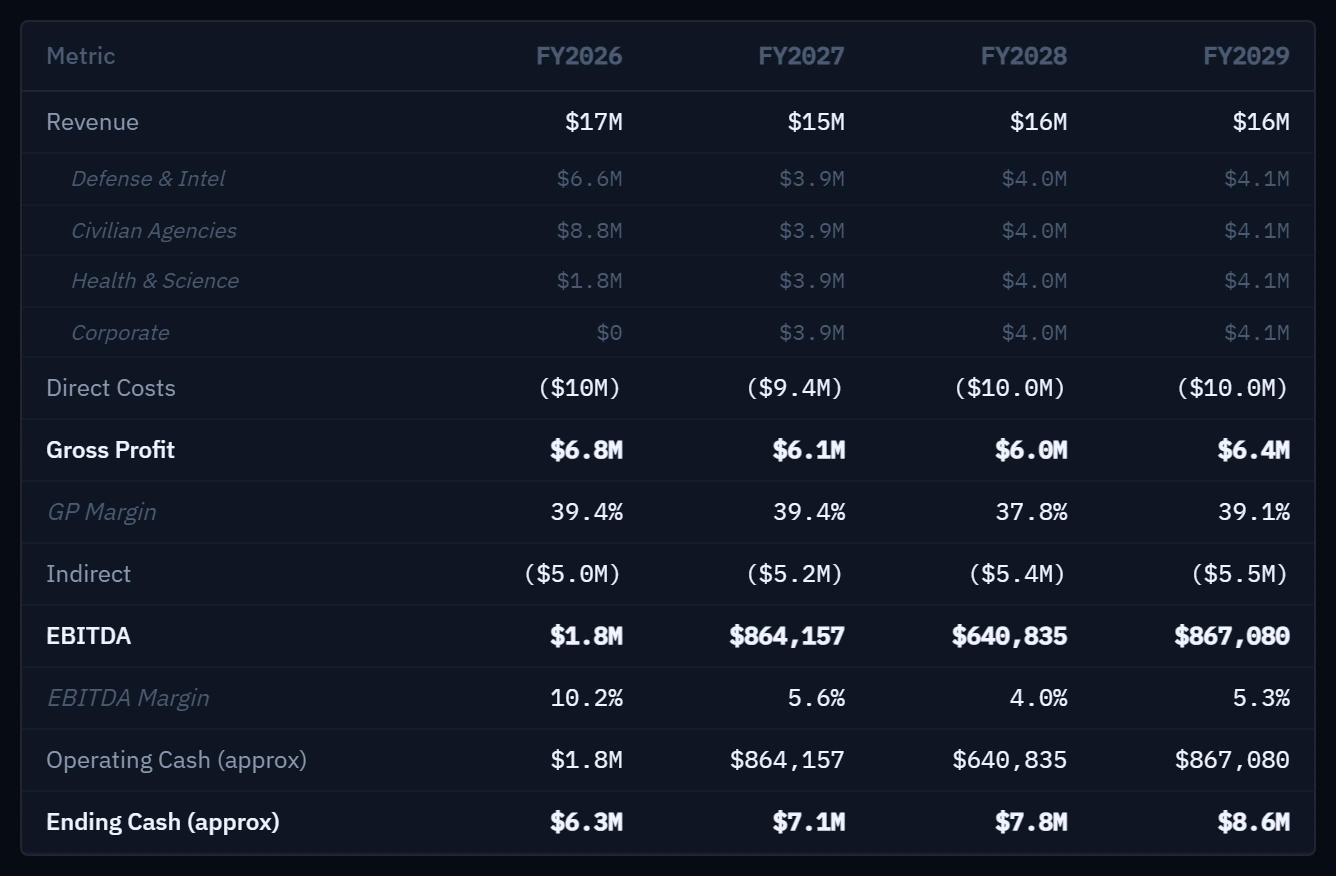
Individual contract forecasts roll up to division totals and company totals instantly. There is no reconciliation step. No version control problem. No question about whether the company total matches the sum of the divisions. The rollup is automatic, immediate, and always current. When a PM changes a forecast entry, the company P&L updates in real time.

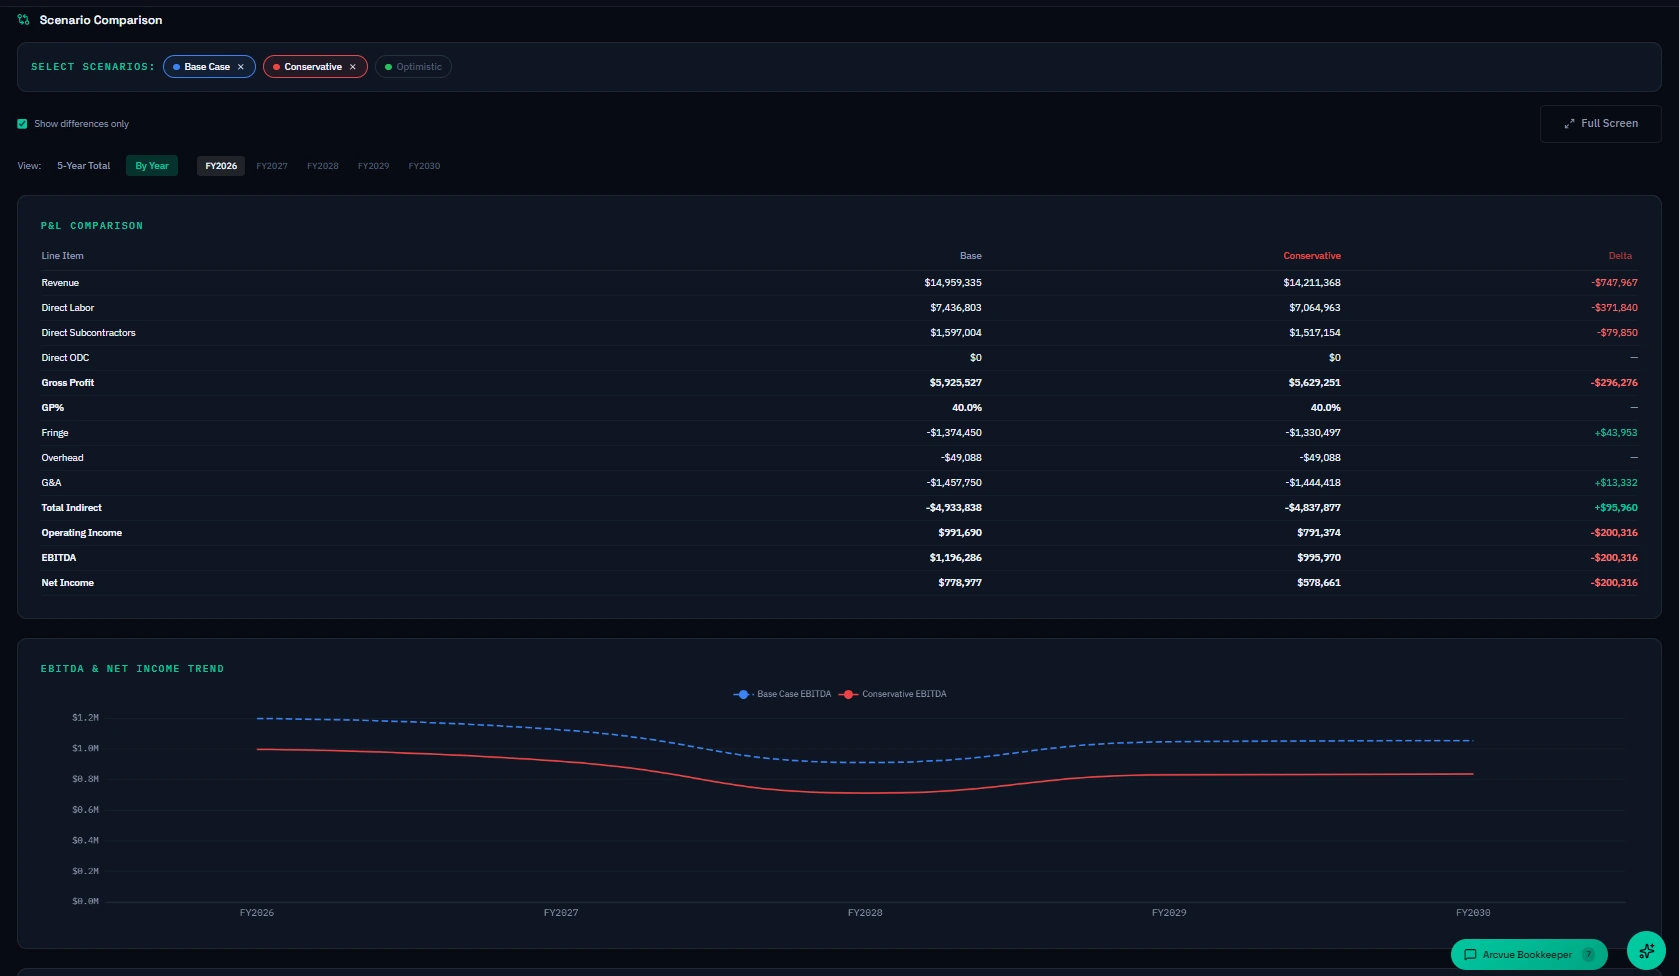
PMs and division leads see contract-level performance alongside their forecast—revenue, cost, gross profit, margin, and burn rate updated nightly from ERP actuals. The what-if tool lets them model a salary change or a billing rate adjustment and see the margin impact before anyone asks. Problems surface before the quarterly program management review, not during it.

  • Replaces the Excel distribution cycle—PMs enter forecasts in the platform, submit with one click, finance approves, company forecast updates automatically
  • Export the approved budget to Excel in ERP-ready format for systems that require manual load—one export, structured correctly
  • Real-time forecasting throughout the year—not just at annual budget time—as actuals flow in nightly from the ERP
  • Five forecast methods—manual, actuals-based, staffing calculator, T&M, and fixed price—selectable per contract
  • Month-level locking—PMs lock finalized months, finance locks closed periods—protected through every subsequent rollup
  • Staffing calculator builds T&M forecasts from headcount and position mix against your live indirect rates
  • Contract-level performance visible to PMs nightly—revenue, cost, GP%, burn rate—before the quarterly PMR
Arcvue — Contract Forecasting
Portfolio Revenue (A+F)
$35.4M
47 active contracts
Portfolio GP%
42.6%
↑ 1.4 pts vs FY25
ContractMethodRevenueGP%Status
HHS CMS QualityT&M$8.5M45.4%● Approved
Army MEDCOMStaffing$3.1M49.0%● Approved
NAVAIR Fleet OpsManual$1.9M14.7%● Submitted
DHS CBP AnalyticsActuals$2.4M38.1%● Pending
Jan–Feb locked · Mar–Dec open
22 of 47 approved
Scenario Planning

Model the decision before you make it.

Your ERP can tell you what the numbers were last month. It cannot tell you what happens to your covenant compliance if you lose a recompete, or what winning a new $5M contract does to your indirect rates. That analysis requires interconnected engines responding to the same change. Excel can approximate it. It cannot model the feedback loops.

When revenue drops, the impact cascades. Lower EBITDA leads to less operating cash. Less operating cash means more draws on the line of credit. More draws mean higher funded debt. Higher funded debt worsens leverage. The higher interest expense on the revolver further reduces the next period's cash. A topside EBITDA adjustment in a spreadsheet misses every step of that cascade. Arcvue runs the full three-statement waterfall on every scenario so the downstream impact is visible before anyone has to ask.

Scenario adjustments cover every material driver of a GovCon P&L. Contract wins and losses—with the ability to pull directly from your pipeline so a specific opportunity in pursuit can be modeled as won or lost. Headcount changes that cascade through direct labor, fringe, and indirect rate absorption simultaneously. Indirect rate changes that reflect the actual pool mechanics, not a percentage adjustment applied to the top line. Acquisition modeling that combines the target's financials with your operating baseline. Price changes by contract that flow through to margin and cash.

Three scenarios run simultaneously—base, upside, and downside—against your actual debt structure and covenant thresholds. A side-by-side comparison shows EBITDA, net income, cash position, DSCR, and leverage across all three. Scenario planning doesn't produce a new set of projections to manage separately. The output is a comparison view that answers the specific question: under what conditions do we breach a covenant, and how much runway do we have?

  • Full three-statement waterfall on every scenario—P&L, cash flow, and balance sheet all respond to the same change
  • Contract win/loss modeling with direct pull from the pipeline—no retyping opportunity data you already entered
  • Headcount changes cascade through direct labor, fringe burden, and indirect rate absorption simultaneously
  • Indirect rate change scenarios reflect actual pool mechanics—not a percentage applied to the top line
  • Three simultaneous scenarios with side-by-side comparison of EBITDA, cash, DSCR, and leverage
  • Covenant compliance tested against actual credit agreement thresholds under every scenario
  • M&A acquisition scenarios combine target financials with your operating baseline and debt structure
Arcvue — Scenario Comparison
MetricBase Case−20% Rev+5% Upside
Revenue$35.4M$28.3M$37.2M
Gross Profit$15.5M$12.4M$16.3M
Adj. EBITDA$5.7M$4.7M$6.2M
Net Income$1.5M$461K$2.0M
DSCR1.48x1.17x ⚠1.60x
Leverage3.21x4.03x ✕2.87x
DSCR MIN 1.20x
−20% scenario approaches threshold at 1.17x
LEVERAGE MAX 3.50x
−20% scenario breaches at 4.03x
Contract Waterfall

Where your revenue is coming from—year by year, contract by contract.

A revenue forecast without a waterfall is a number without a story. The contract waterfall answers the question every buyer, lender, and board member asks next: show me where it comes from. Arcvue builds it to investment banking and lender industry standards—the same format diligence teams use to examine GovCon businesses. Start looking at your own business the way a buyer or lender will before they ever ask to.

The waterfall decomposes your total revenue forecast into three buckets across the full forecast horizon. Active contracts—the revenue you can count on from contracts currently in performance, projecting forward based on period of performance, funded value, and burn rate. Recompetes—contracts approaching their end date that you expect to retain, each tracked with its recompete probability and timeline. New growth—net new contract wins required to hit your growth targets, sourced from the pipeline module so each new growth assumption ties to a specific opportunity or division-level target.

The decomposition runs year by year from the current period out to the end of your forecast window. The shape of the waterfall tells the story: a firm with strong active backlog has a different risk profile than one whose growth plan depends heavily on new awards. A buyer evaluating the revenue quality, a lender assessing cash flow stability, and a board reviewing the growth plan are all reading the same picture—the one that shows how the number is built, not just what it is.

Pipeline coverage ratios are computed against each year's growth target by division. The ratio tells you how much unweighted pipeline you need to win to cover your growth assumption. In GovCon, every opportunity is binary—you win it or you don't. The coverage ratio uses unweighted pipeline because probability weighting gives a false sense of precision on individual bids. High coverage is defensible. Low coverage is a flag—and surfacing it in a regular board review is far less painful than surfacing it in a lender call or a diligence process.

The waterfall format is built to investment banking and lender industry standards. The decomposition, the labeling, the coverage ratios—these are the exact exhibits a diligence team builds when evaluating a GovCon business. Firms that review their own waterfall regularly arrive at a process already knowing the answers to the questions that slow transactions down. The ones that build it for the first time under deadline pressure discover their gaps when it costs the most to fix them.

  • Revenue decomposed into active contracts, recompetes, and new growth—year by year across the full forecast horizon
  • Active contract projections built from period of performance, funded value, and actual burn rates—not estimates
  • Recompete tracking with probability and timeline—each contract's renewal risk visible before the pursuit begins
  • New growth tied directly to pipeline—each growth assumption links to a specific opportunity or division-level target
  • Pipeline coverage ratios by division and year—unweighted, because in GovCon every bid is binary
  • Built to investment banking and lender industry standards—the format diligence teams use to examine GovCon businesses
  • Run your own business the way buyers will analyze it—before they ever ask to
Arcvue — Contract Waterfall
CategoryFY26FY27FY28FY29
● Active Contracts$28.4M$22.1M$16.8M$9.2M
● Recompetes$2.8M$7.4M$9.2M$14.1M
● New Growth$4.2M$8.8M$14.1M$18.7M
Total$35.4M$38.3M$40.1M$42.0M
Coverage (by div.)FY26FY27FY28FY29
Federal Health4.2:13.8:12.9:12.3:1
Defense & Intel8.7:119.4:118.7:114.8:1
Civilian2.0:16.5:16.3:15.8:1
Next

BD & Pricing →

Proposals built on your real cost structure. Market intelligence from GSA CALC+ and USAspending.gov. Solicitation monitoring across SAM.gov and eBuy.

See BD & Pricing

See your forecast built from your actual contracts.

Connect your ERP and walk through a live demo. Your contract history, your pipeline, your waterfall.

Try the Demo