Every M&A and financing tool in the market works from a model you build manually. Arcvue works from your live ERP data—the P&L that closed last night, the indirect rates computed this morning, the contract waterfall that reflects your actual backlog. The analysis isn't a projection built on assumptions. It's your real operating baseline with deal terms layered on top.
When a target comes across your desk, the first question isn't the multiple—it's what the combined entity looks like and whether you can finance it. That answer normally takes two weeks of banker modeling against projections built from the ground up. Arcvue has your operating baseline already. The deal terms are the only new inputs.
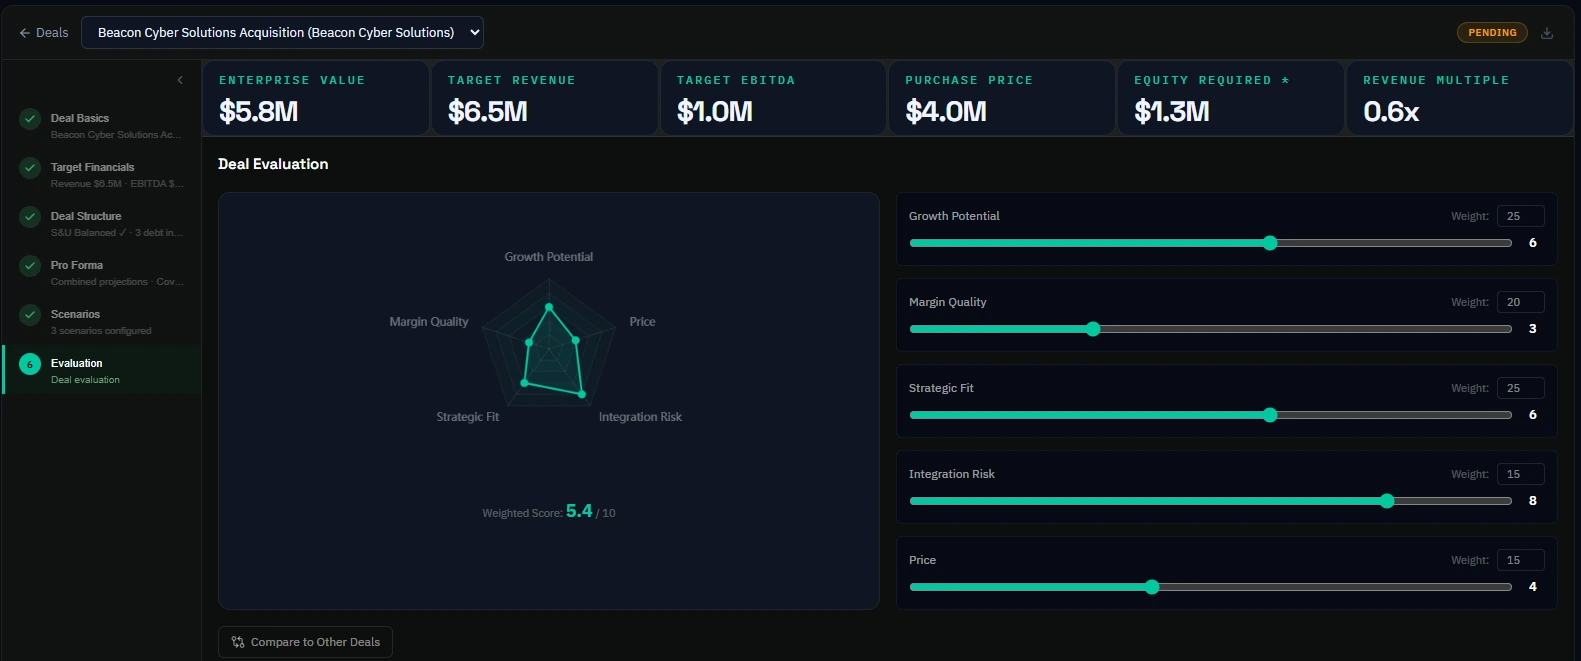
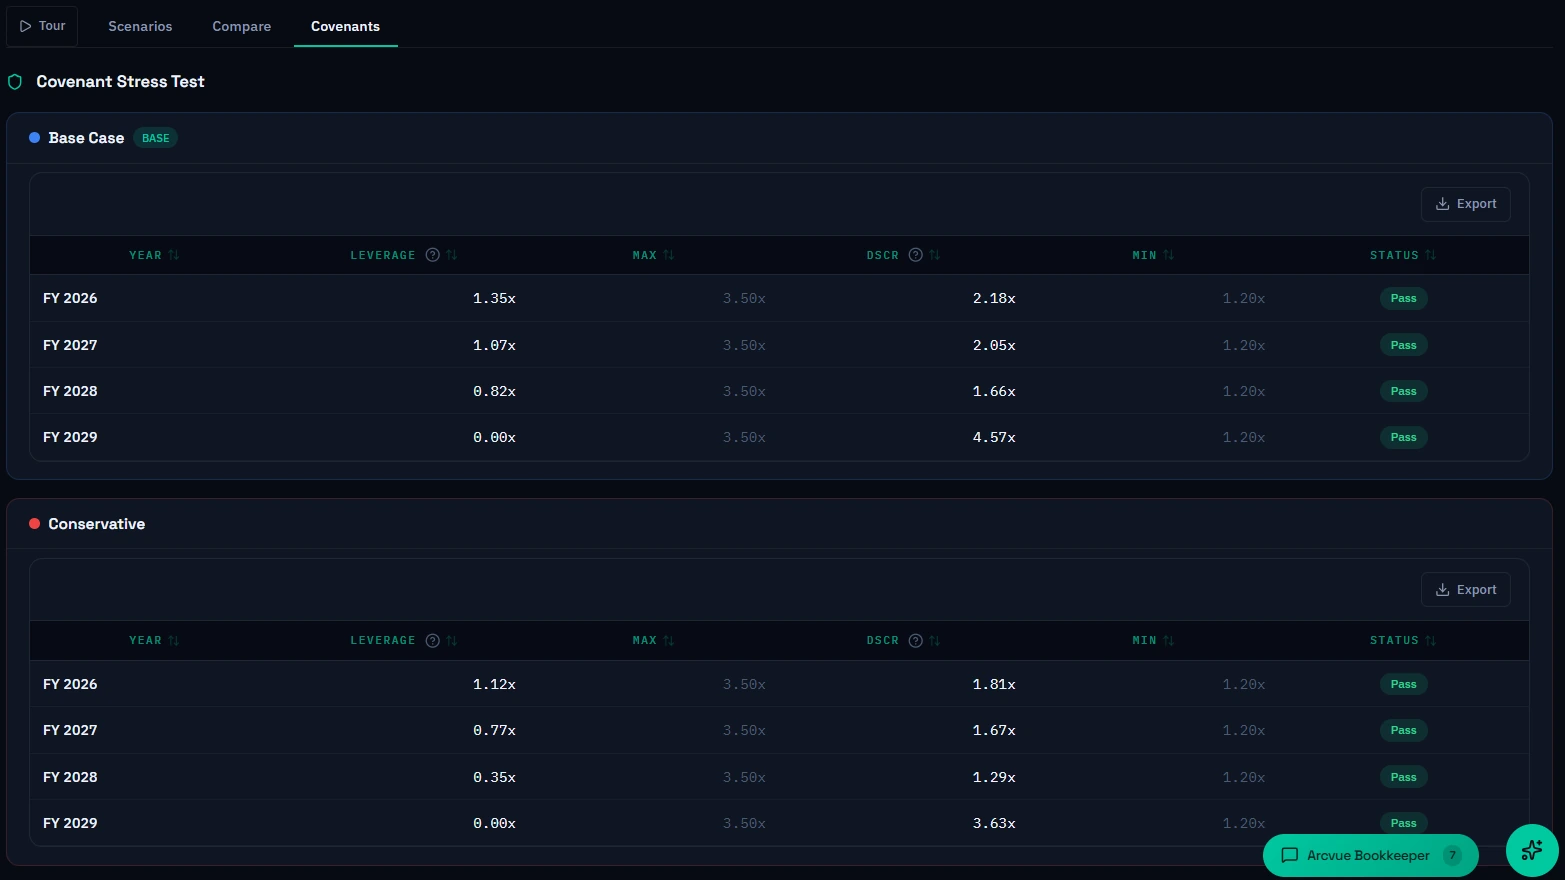
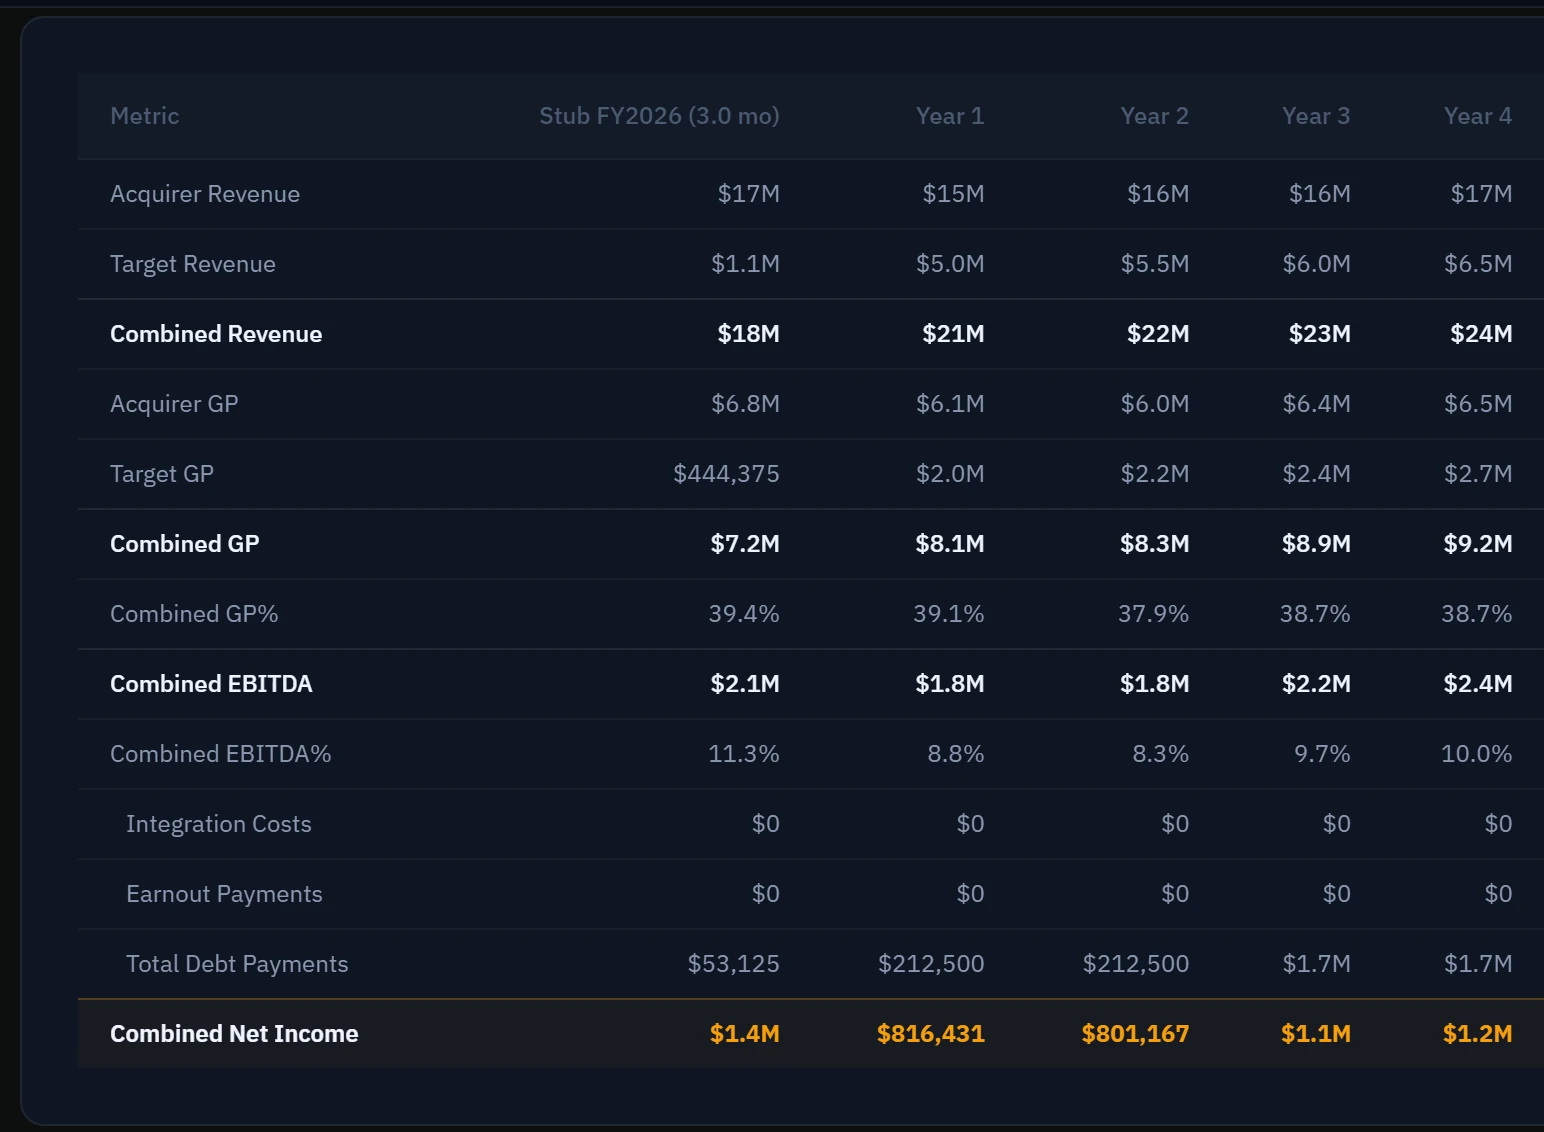
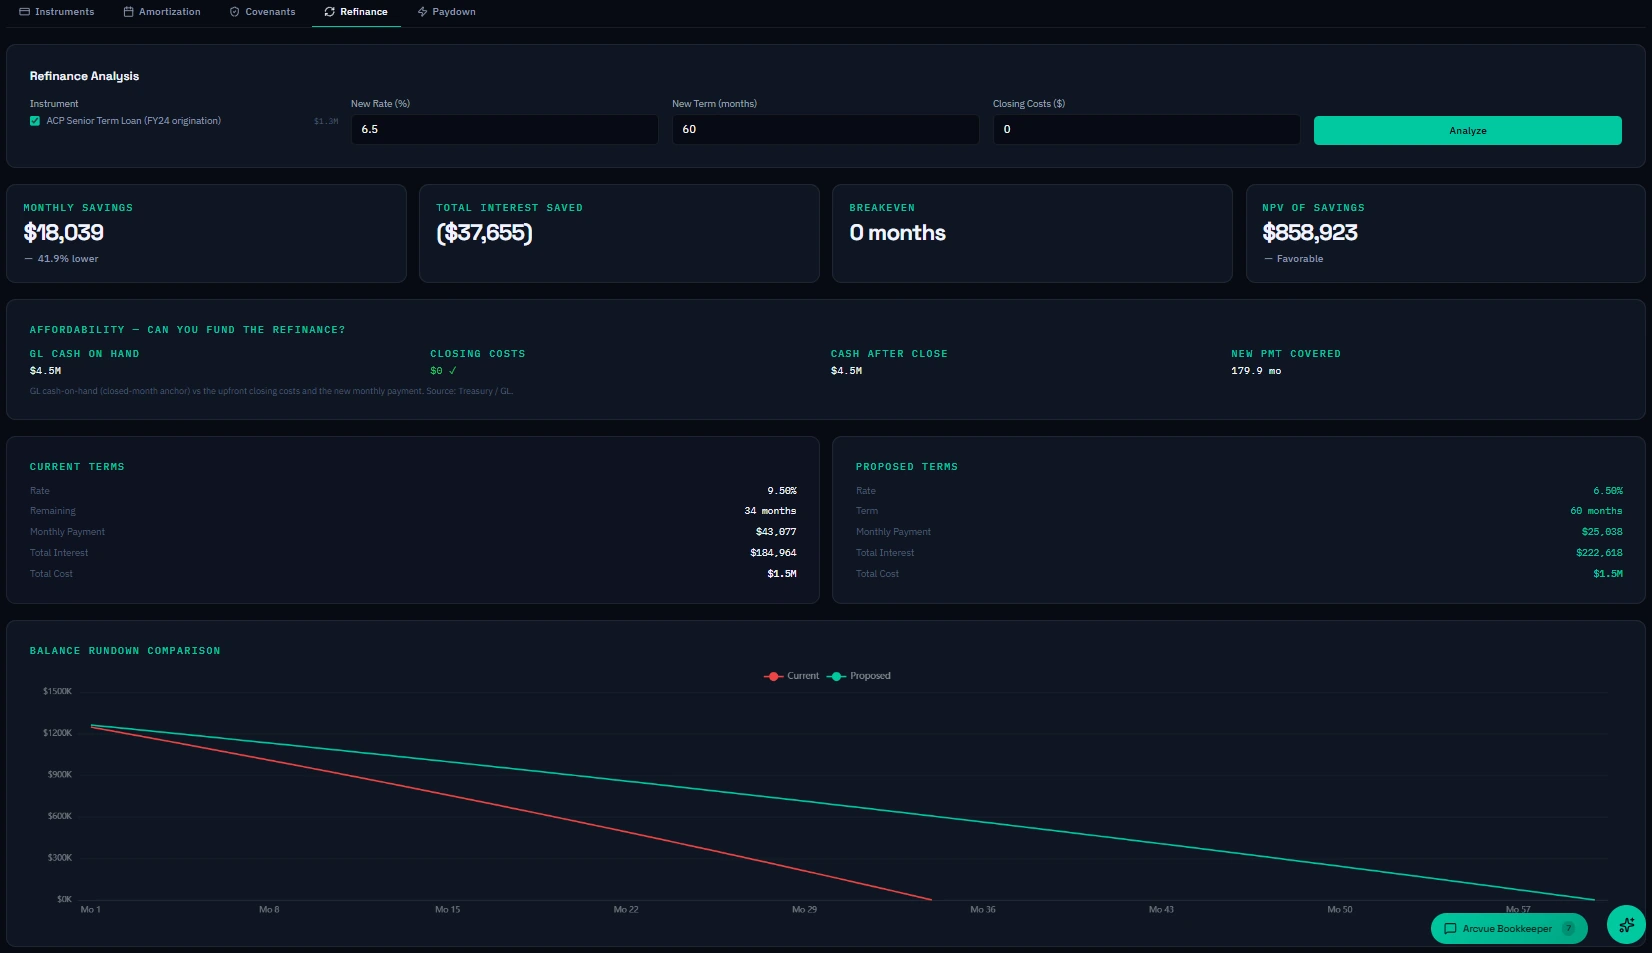
Enter the target's revenue, EBITDA, and purchase price. Select a debt structure—traditional senior, unitranche, or seller-financed. Arcvue computes sources and uses, post-close three-statement projections, covenant compliance under the combined debt load, and equity return at exit—all against your actual P&L and balance sheet from last night's ERP sync. The combined entity's indirect rate structure reflects both companies' actual cost pools. The covenant projections use your real debt schedule and your actual credit agreement thresholds, not placeholders.
Multiple deals can be evaluated simultaneously. A two-target acquisition—evaluating two tuck-ins at once and modeling the combined entity against your platform company—runs in the same workspace. Each target has its own financials. The combined sources and uses, debt structure, and covenant compliance reflect all three entities together. The analysis that previously required a separate model for each permutation runs in one place, against the same baseline, with results that are directly comparable.
Post-close integration is handled through multi-entity consolidation. Both ERPs connect to Arcvue independently on day one of the hold. The combined P&L, indirect rate structure, and covenant metrics are available the morning after onboarding—not six months into an ERP integration project that may never fully resolve. For PE-backed platforms evaluating add-ons, this means the combined view exists before the ink is dry.
Earnouts are one of the most negotiated elements of a GovCon acquisition and one of the least rigorously modeled. Whether you're financing the deal with debt or writing a check, a future earnout obligation is a cash commitment that competes with everything else you want to do with that money—reinvesting in BD, hiring, working capital, paying down debt. Getting the threshold wrong means paying out cash at precisely the moment the business needs it for something else. Arcvue models earnouts the way a sophisticated buyer actually thinks about them: as a range of possible obligations, each with specific cash and capital consequences.
The earnout sensitivity matrix shows nine rows by default: the negotiated threshold plus or minus four steps at a configurable interval. Each row shows the earnout payout under three scenarios—downside, base case, and upside—computed against your actual target financial projections. You see not just what the earnout pays at the negotiated number, but what it pays at every plausible performance level, in both directions.
Every cell in the sensitivity matrix shows the earnout payout alongside a cash flow impact panel—what the payment does to your liquidity position in the year it occurs, how much cash remains available for reinvestment, and how the cumulative purchase price changes your effective entry multiple. The threshold-setting conversation becomes concrete: at what performance level is the business generating enough incremental value that paying the earnout is clearly accretive, versus where it merely transfers cash from the acquirer's balance sheet to the seller's without a corresponding benefit to the combined entity?
For buyers with debt in the structure, every cell is also tested against post-close covenant thresholds in real time. When a payment at a given threshold and scenario would push leverage above your credit agreement maximum or drop FCCR below your minimum, the cell flags automatically—using your actual debt schedule and your actual covenant terms. The negotiation conversation shifts from "what's the earnout number" to "at what performance level does paying the earnout create a cash or covenant problem, and how do we structure around that?"
Earnout metric selection covers gross profit, adjusted EBITDA, and revenue, with adjustment layers for each—subcontractor pass-throughs, non-recurring contract transitions, management compensation normalization. The adjusted earnout metric is built to be defensible in a purchase agreement, not a back-of-envelope approximation. Payment timing—same year, following year, or six-month lag—feeds directly into the cash flow impact panel so you see exactly what the payment does to your liquidity position and covenant headroom in the year it occurs.
Every lender model you've ever seen was built manually by an analyst working from a data room, a management presentation, and a set of projections assembled for the process. Arcvue generates it from the source—your actual ERP data, your actual contract waterfall, your actual indirect rates—with deal terms layered on top. Not an approximation. The real numbers, in the format lenders expect.
The export produces a complete, formatted Excel workbook in a single click. Cover tab with deal summary, company overview, and contact information. Historical P&L from your actual ERP actuals. Projection model with five years of post-close income statement, cash flow waterfall, and debt schedule with full amortization by instrument. Covenant analysis showing DSCR and leverage against your actual credit agreement thresholds year by year. Cap table showing the capital structure at close and at each exit year. Revenue summary by contract with funded value, ITD revenue, and period of performance. Indirect rate history from your actual cost pools. GovCon-specific credit metrics—funded backlog coverage, contract concentration analysis, top customer revenue waterfall—that general-purpose M&A models never include because they don't know to ask for them.
The workbook is built to the format investment bankers and credit analysts recognize. When your banker opens it, they're not reformatting—they're presenting. When the credit committee opens it, the GovCon metrics speak directly to the questions they have about this asset class that they don't always know how to ask: what percentage of revenue renews automatically, what's the single-customer concentration risk, what does the indirect rate history say about cost discipline. The answers are there before the questions come.
For multi-target deals, the workbook reflects the combined entity—platform company plus one or two targets—with consolidated projections, combined debt schedule, and covenant compliance across the full capital structure. The same export that works for a single tuck-in works for a two-target simultaneous close.
Capital structure decisions are made against projections that someone builds when a specific transaction is on the table. Arcvue keeps your capital structure modeled continuously—so when a rate environment changes or a lender calls, the analysis takes minutes, not weeks.
Every instrument in your capital structure is tracked in the platform: senior term loans, revolving lines of credit, seller notes, subordinated debt. Principal balances, interest rates, amortization schedules, and covenant thresholds are all maintained. Covenant compliance—DSCR and leverage—is computed nightly against your actual operating data so you know your current headroom before anyone asks.
When you want to model a refinancing—lower rate, different term, different covenant structure—the platform runs the new instrument against your current forecast and shows you the impact: monthly payment change, breakeven on closing costs, total interest saved over the term, and leverage under the new structure. The scenario planning module connects this to your operating model so a refinancing that changes your monthly cash obligation also changes your 13-week cash forecast, your LOC draw behavior, and your covenant projections for the full period.
Accelerated paydown analysis answers the question your controller and your banker are asking from different directions: what does it cost you in liquidity to pay down faster, and what does it save you in interest and leverage? The answer runs across your actual cash position, your LOC availability, and your covenant headroom—so the tradeoff between cash conservation and debt reduction is visible against your real constraints, not a generic model.
Value Builder runs a ten-factor diagnostic against your live ERP data at every monthly close—automatically, without any action required. The factors are the ones buyers and lenders actually evaluate: set-aside concentration and its change-of-control implications, contract concentration above the 25% threshold where lenders begin asking hard questions, prime/sub mix and what it signals about revenue control, recompete risk relative to normal portfolio cadence, customer desirability across the agency tier spectrum, capability premium by service type, revenue trajectory, EBITDA margin, addback quality, and management depth.
The History tab shows how each factor has moved quarter by quarter going back up to two years, reconstructed from your actual historical data. If you have received feedback from a banker, lender, or advisor on a specific attribute, set a goal—the platform tracks progress automatically at every close and every new contract addition. No manual update. No spreadsheet.
The implied valuation range displayed alongside the composite score is a directional indicator—not a formal valuation. It reflects how the GovCon M&A market generally responds to portfolios with similar characteristics. M&A is not a science. A qualified investment banker accounts for the full picture. Value Builder makes sure you arrive at that conversation already knowing what they are going to find.
Board packages, division reports, covenant packages, and audit export—generated automatically from your live data.