Home Features Use Cases Pricing Docs Try the Demo
Features — Financial Intelligence

Your books.
Live and actionable.

Most GovCon firms know what their ERP contains. Getting it out in a usable form—by entity, by division, with indirect rates applied, in a format leadership can act on—requires a layer the ERP was never designed to provide. Arcvue is that layer.

0
Manual steps between books closing and your P&L being available
Nightly
ERP sync — actuals for closed months, forecast for open months, automatically combined
Next AM
Consolidated multi-entity view available after onboarding — not six months into an ERP integration
Financial Statements

P&L, balance sheet, and cash flow—the moment your books sync.

The data is in the ERP. The problem is getting it out in a form leadership can use without someone spending half a day pulling and formatting it.

Arcvue syncs your ERP nightly and makes your income statement, balance sheet, and financial summaries available by company and division every morning—without anyone having to run a report or export a spreadsheet. The cycle of "can someone get me the numbers" goes away entirely. The person who used to spend time on that can focus on something more valuable.

Actuals for closed months pull directly from ERP data. Open months roll forward using your current forecast. The two are combined automatically so the view is always current—not just through the last close, and not just a projection from the start of the year. Every number is traceable back to its source: an ERP transaction for actuals, a division lead's forecast entry for open months.

Division-level P&L gives every division lead visibility into their own performance—revenue, costs, gross profit, and margin—without requiring a report request. The CEO and CFO see the consolidated rollup. Nothing has to be reconciled between the two views because they come from the same data.

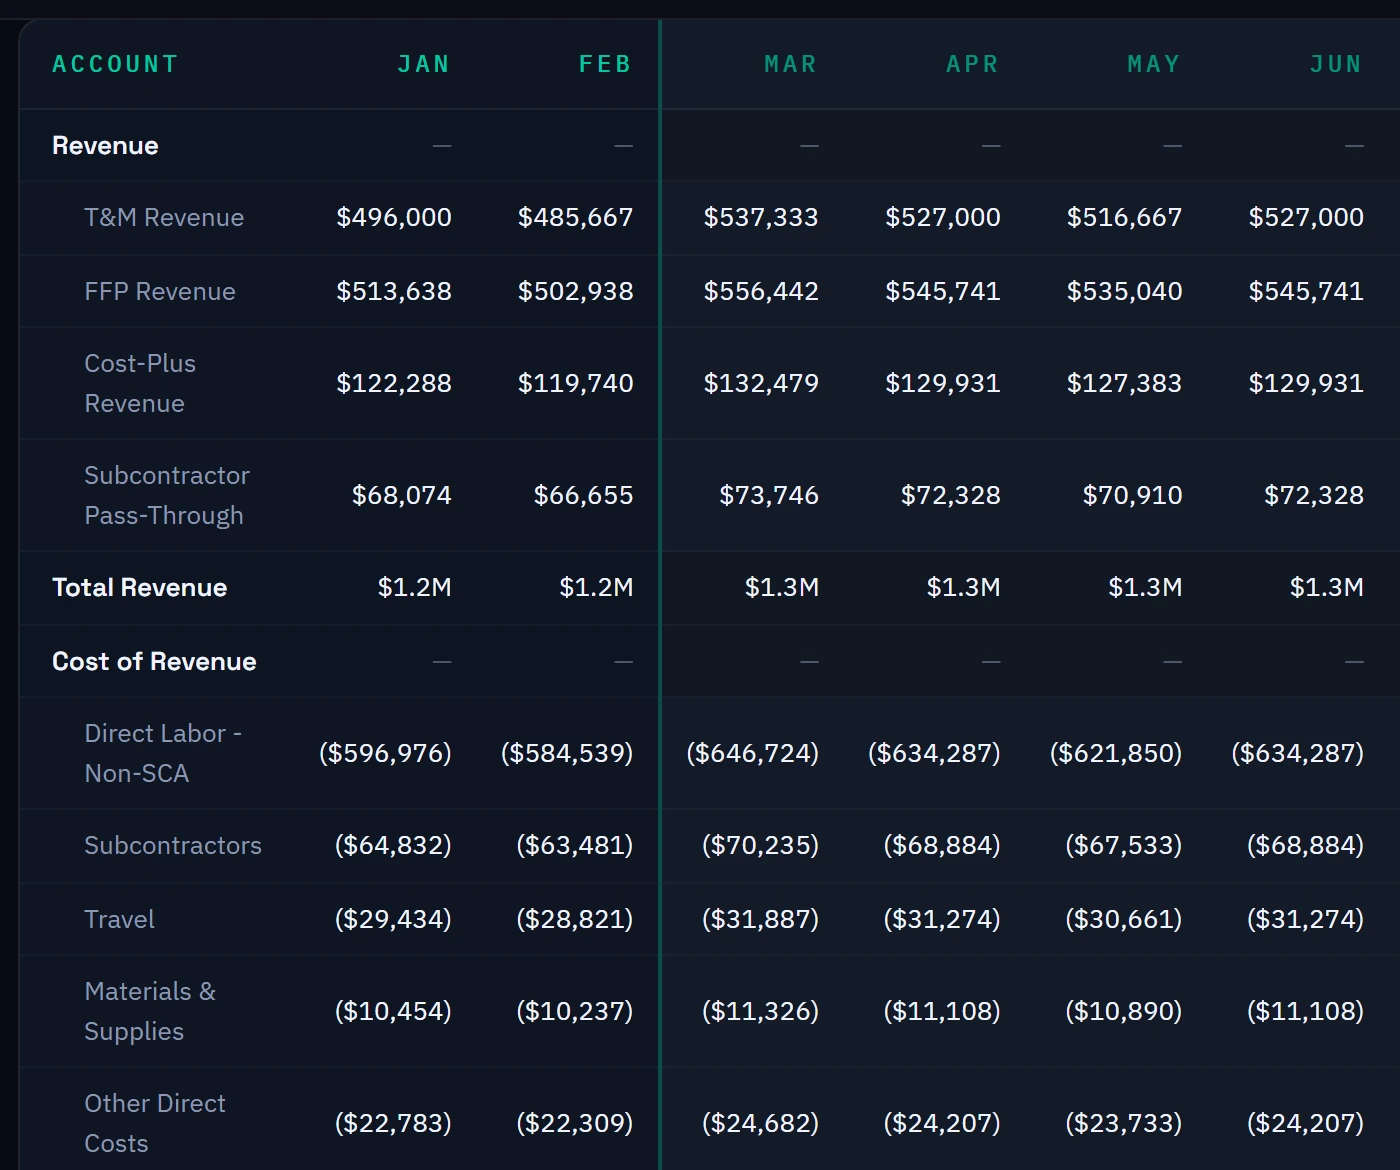
  • Income statement by company and division with actuals through last close and forecast for remaining months
  • Balance sheet with assets, liabilities, and equity—verified to balance after intercompany elimination
  • Year-over-year comparison and variance analysis available without building it manually
  • Every number traceable to source: ERP transaction for actuals, forecast entry for projections
  • Role-based access: division leads see their division, executives see everything
Arcvue — P&L by Division · FY2026
FY26 Revenue (A+F)
$35.4M
↑ $2.1M vs FY25
GP% (A+F)
38.2%
↑ 1.4 pts vs FY25
DivisionContractsRevenueGP%
Federal Health14$16.8M45.4%
Defense & Intel12$12.4M49.0%
Civilian Agencies15$9.2M38.2%
Corporate Services6$4.8M31.1%
DATA SOURCE
UNANET sync · Jan–Feb actuals · Mar–Dec forecast · Updated 06:14 AM
Indirect Rates

Fringe, overhead, and G&A—from actual cost pools, every morning.

Somewhere in your organization there's an indirect rate model that someone built years ago. One person understands how it works. It gets updated once a year—maybe.

Arcvue computes your indirect rate pools nightly from ERP actuals. Fringe, overhead, and G&A are derived from the actual cost transactions in your books—not from a spreadsheet model maintained separately from the ERP. When you hire someone, when a contract ends, when expenditures fluctuate across pools, you see the rate impact the next morning instead of at the next annual recalculation.

Mid-size and larger contractors routinely maintain multiple cost pools within a single pool category—separate fringe pools for different labor classifications, multiple overhead pools by division or contract type, segmented G&A structures. Arcvue handles any pool configuration your accounting system uses. The rates that flow into pricing proposals and scenario models reflect your actual pool structure, not a simplified average. As a practical example: firms performing Service Contract Act work maintain separate SCA and non-SCA fringe pools because the fringe obligations differ by labor category. Arcvue tracks each pool independently so T&M and labor-hour bids price each position correctly against the right fringe burden—not a blended rate that understates cost on SCA positions and overstates it on others.

Indirect rates feed directly into the pricing module, the contract forecasting engine, and the scenario planner. When you model a new hire or a contract win in a scenario, the rate impact flows through automatically—because the rates are live data, not a static input someone has to remember to update.

  • Fringe, overhead, and G&A computed nightly from actual ERP cost pools—not an annual model
  • SCA and non-SCA fringe pools maintained separately for accurate T&M pricing and compliance
  • Composite wrap rate derived automatically from all three pools plus fee
  • Provisional rates tracked alongside actual rates for year-end true-up documentation
  • Rate history maintained monthly—DCAA audit trail built automatically, not reconstructed under pressure
  • Live rates flow directly into pricing proposals, contract forecasts, and scenario models
Arcvue — Indirect Rates · Mar 2026
Fringe — Non-SCA
32.4%
↓ 0.8 pts from Feb
Fringe — SCA
41.2%
↑ 0.3 pts from Feb
Overhead
14.1%
Stable
G&A
12.8%
↓ 0.4 pts from Feb
Composite Wrap Rate (Non-SCA)
1.78x
From Mar 2026 actuals
Composite Wrap Rate (SCA)
1.94x
From Mar 2026 actuals
Provisional vs Actual
Provisional: 31.0% fringe · Actual YTD: 32.4% · True-up tracked monthly
Treasury & Cash Flow

Where your cash is going—before it gets there.

GovCon ERPs are built for cost accounting and contract billing—not cash flow visibility. The cash flow statement and forward-looking cash position are the reports that didn't exist before Arcvue, or existed as a spreadsheet someone maintained manually alongside the ERP.

Arcvue generates the cash flow statement automatically from your actuals and forecast—working capital movements, debt service, and a forward-looking cash position that tells you where you're headed, not just where you've been. AR collections, payroll disbursements, LOC draws, and debt service are all computed from real data—not a model someone maintains separately from the ERP.

Enter your bank balance today and the platform anchors the entire cash picture around it. Eight weeks of historical actuals show how you got to your current balance. Thirteen weeks of forward projections show where you're going. This is particularly useful when you run accrual-based financials—your ERP balance and your bank balance routinely differ, and understanding the bridge between them requires exactly this kind of cash-basis visibility that accrual statements don't provide.

The 13-week forecast is driven by historical receipt and payment trend analysis—not manual entry of every expected inflow and outflow. Arcvue analyzes your actual AR collection patterns by client and contract type, your payroll cadence, your vendor payment behavior, and your LOC draw history to project forward. When conditions change—a large invoice clears, a contract starts drawing faster, a payroll cycle shifts—the forecast reflects it automatically the next morning.

AR and AP aging are tracked invoice by invoice. Outstanding invoices are bucketed by days past due—current, 30-60, 60-90, 90+—with contract and client detail so collections conversations happen at the right level. AP aging gives the same visibility on the payables side. The treasury module feeds directly into the 13-week forecast so collection timing is reflected in the cash position, not approximated.

  • Enter today's bank balance — the platform rolls 8 weeks back and 13 weeks forward, anchoring your cash picture around actual bank activity
  • 13-week forecast driven by historical trend analysis—AR collection patterns, payroll cadence, vendor payment behavior—not manual input
  • Bridges accrual financials and cash reality—see exactly why your bank balance differs from your ERP balance
  • AR aging with invoice-level detail by contract and client—current, 30-60, 60-90, 90+ buckets
  • AP aging by vendor with subcontractor payable tracking separate from general AP
  • LOC draw and paydown tracked against facility limit with utilization trend
  • Debt service schedule integrated into cash forecast—principal and interest by instrument
Arcvue — Treasury · Cash & LOC
Cash Balance
$1.2M
As of today
LOC Drawn
$4.8M
80% of $6.0M facility
13-Week Cash Position
AR AgingCurrent30-6090+
Federal Health contracts$842K$124K$38K
Defense & Intel contracts$1.1M$88K
Multi-Entity Consolidation

Even getting multiple entities onto the same ERP is a false summit.

You spend six months on the integration. You get there. And the consolidation problem is still waiting at the top—because ERPs are not designed for multi-entity structures where both entities remain legally separate. In GovCon, they often remain legally separate.

GovCon acquisitions are almost always stock purchases. The acquired company becomes a wholly owned subsidiary, but it retains its own contracts, its own past performance record, its own security clearances, and its own legal identity. Contract novation requires the government's agreement—which takes months and may not be granted. The entity has to stay. So both entities stay on their own books, and someone reconciles two sets of financials in Excel every month—even after years of shared ownership.

Arcvue doesn't require ERP consolidation—or even the same ERP platform. The parent can run UNANET while the subsidiary runs Costpoint or QuickBooks. Each connects to Arcvue independently through its own adapter. A normalization engine translates both data streams into a common schema. Intercompany transactions are identified and eliminated automatically. The consolidated P&L, balance sheet, and covenant metrics are available the next morning. Not six months from now. Not after a consulting engagement. The morning after onboarding.

Chart of accounts normalization happens during onboarding using AI-assisted classification confirmed by the controller. Account 5100 in one system maps to the same semantic category as account 6200 in the other. The mapping is a one-time exercise. After that, new accounts get classified automatically as they appear. No annual maintenance. No consultant required.

Intercompany eliminations run automatically every night. Management fees, due-to and due-from balances, intercompany revenue—all identified and eliminated in the consolidated view. Nobody has to remember to do it. Nobody has to verify the math. The elimination runs with the sync and the consolidated balance sheet foots automatically.

  • Connects across different ERP platforms—UNANET, Costpoint, QuickBooks, JAMIS, and others—through a normalization engine that translates each into a common schema
  • Chart of accounts normalization using AI-assisted classification—one-time setup during onboarding
  • Intercompany eliminations run nightly—management fees, due-to/due-from, intercompany revenue all handled automatically
  • Consolidated P&L, balance sheet, and covenant metrics available the morning after onboarding
  • Indirect rates computed for each entity separately and for the combined cost structure
  • Role-based entity access—division leads see their entity, executives see the consolidated view, lenders see what you choose to share
Arcvue — Consolidated View · FY2026
EntityRevenueEBITDANet Income
Parent Co.$28.4M$4.2M$1.1M
Subsidiary$6.8M$1.5M$540K
Intercompany Elim.($1.2M)
Consolidated$34.0M$5.7M$1.6M
ELIMINATED
$1.2M
Intercompany — nightly
BS CHECK
A = L + E
Verified to the penny
ERP CONNECTIONS
UNANET (Parent) · Costpoint (Subsidiary) · Both synced independently
Next

Forecasting & Planning →

Contract forecasting, scenario modeling, and the contract waterfall.

See Forecasting & Planning

See your own financial data in the platform.

Connect your ERP and walk through a live demo. Under 90 minutes from first sync to live dashboard.

Try the Demo