Home Features Use Cases Pricing Docs Try the Demo
Features — Reporting & Compliance

Reports that run themselves.
Documents that build themselves.

The reporting and compliance work that consumes your team every month—board package assembly, waterfall creation, covenant packages, audit PBC lists—is compilation work, not analysis work. Arcvue automates the compilation, generates the documents, and surfaces the checks so your team can focus on what the numbers mean, not on producing them.

Auto
Board packages, waterfall, covenant reports, and division summaries triggered on close—no one assembles, no one remembers
Weeks → hours
Contract waterfall generated automatically from live data—the exhibit investment bankers spend weeks producing, available on demand
Every table
Every report, every table, every view—exportable to Excel or PDF directly from the application, one click
Reporting & Distribution

Configure it once. From that point forward it just happens.

Board reporting in most GovCon firms is a quarterly exercise that takes days. Someone pulls the numbers, builds the slides or document, checks it against last quarter, formats it, and distributes it. The people who need the information wait for the people who produce it. When the producer leaves or changes roles, the process breaks.

Arcvue auto-generates reports and delivers them via email to the right stakeholders the moment your books close. Not scheduled for a fixed day each month—triggered by the actual close event. The board package goes out when January closes, not on the fifteenth of February because that's when someone remembered to run it. The covenant package goes to your lender the same day. Division summaries go to division leads before they've asked. Nobody has to remember. Nobody has to format anything.

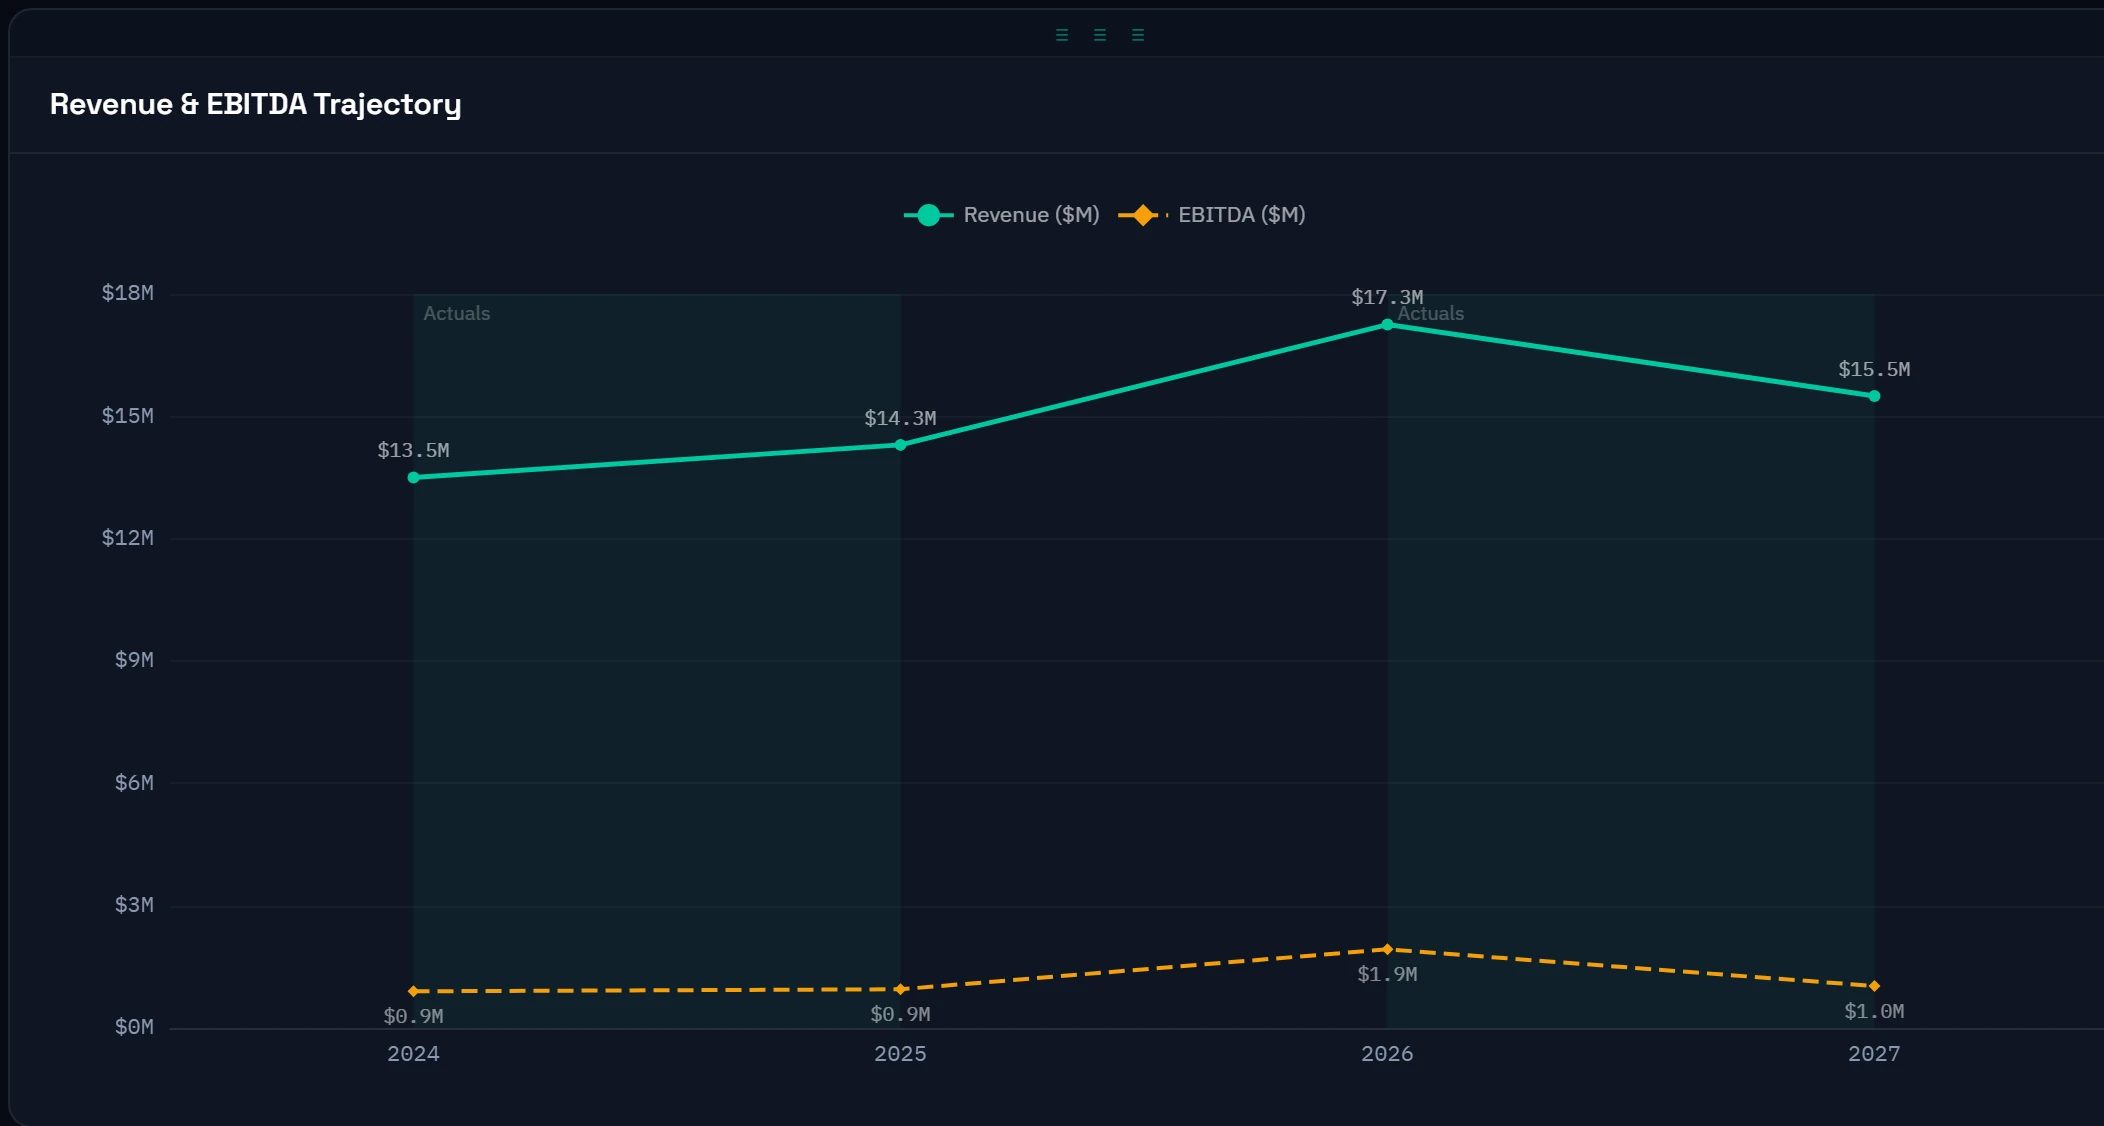
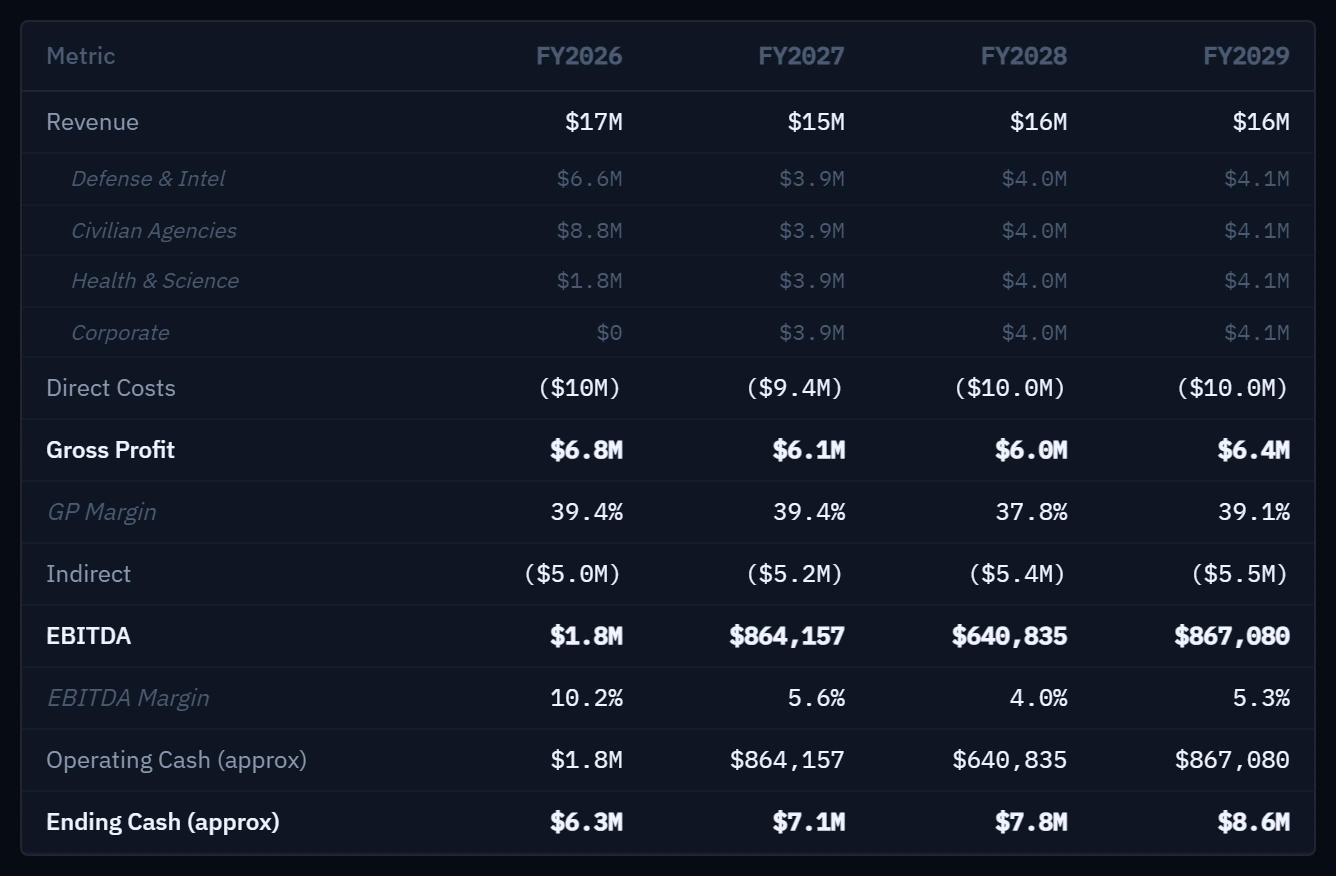
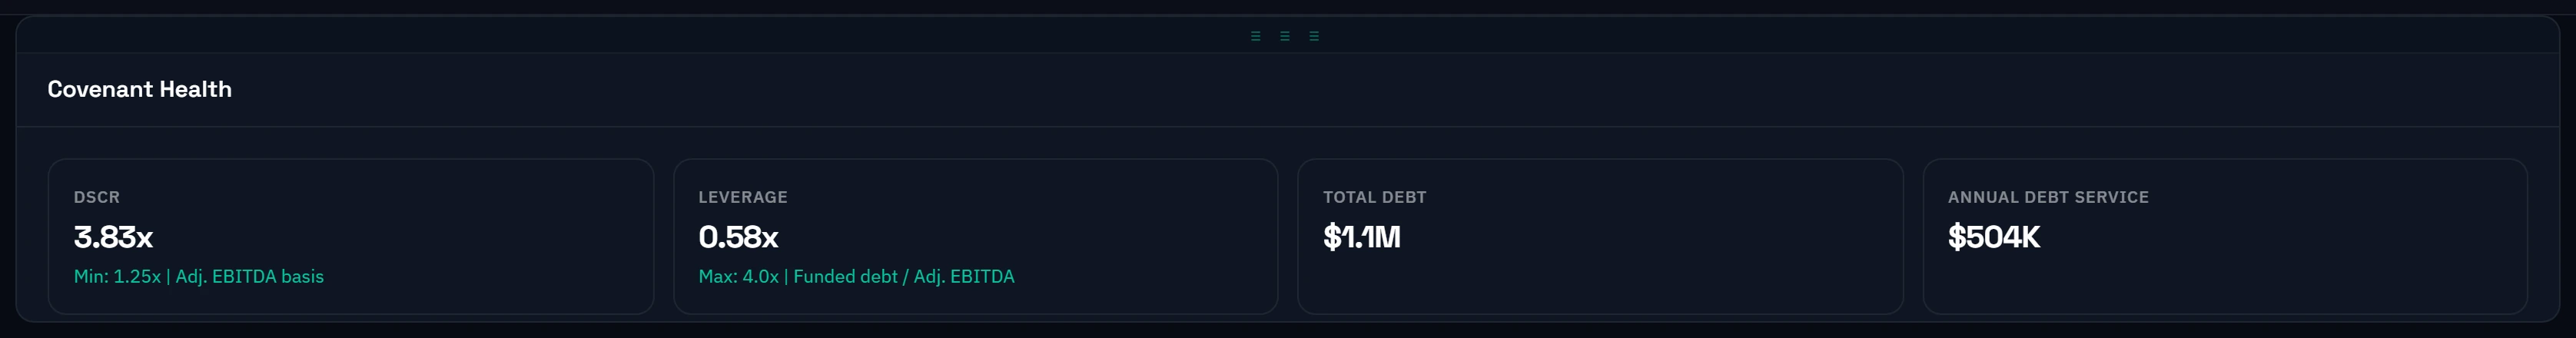
Each report is configured for its audience—not a generic view everyone receives and filters for themselves, but a view built for the decisions that audience makes. The board tab shows company-level revenue, EBITDA, cash, covenant status, and pipeline coverage. The CEO and CFO tab adds the full P&L with division breakdown, balance sheet, and 13-week cash position. The COO tab shows contract performance, forecast status by division, and operational metrics. The CGO tab shows pipeline by division, coverage ratios, and BD performance including win/loss history. Division directors see their own contracts and margins—nothing from other divisions, nothing corporate. Each stakeholder gets exactly what they need and nothing they don't.

Every dashboard includes an LLM-driven summary tailored to that audience's view—a plain-English synthesis of the most important changes in recent financial and contract performance that the respective role needs to know. The board summary flags covenant headroom and major revenue changes. The CGO summary calls out pipeline coverage gaps and recent bid outcomes. The division director summary highlights the contracts with significant variance from plan. The insight is surfaced, not buried in tables for the reader to find.

In-application alerts notify stakeholders when something material changes across the platform: a covenant approaching its threshold, a large contract variance from forecast, an indirect rate movement outside normal range, a new solicitation scored high in the BD module. Alerts are role-scoped so the right person is notified about the right event—not a broadcast to everyone about everything.

Every report exports to PDF from within the application. Every table exports to Excel. Drag and drop customization lets you configure the layout and visibility of each report section per audience without touching any code. For PE-owned companies and firms with lender relationships, configurable investor and lender access shares a live view of the agreed metrics—updated nightly from the ERP, no quarterly package required.

  • Reports triggered by the close event—not scheduled, not manual, not dependent on anyone remembering to run them
  • Six audience-specific views—board, CEO/CFO, COO, CGO, division directors, investor/lender—each built for its decisions
  • LLM-driven summary per audience—plain-English synthesis of the most important recent changes, surfaced automatically
  • In-application alerts for material changes—covenant approaching threshold, contract variance, rate movement, high-scoring solicitation
  • Every report exports to PDF, every table exports to Excel—from within the application, one click
  • Drag and drop layout customization—configure each audience view without code
  • Configurable investor and lender access—live metrics updated nightly, no package assembly
Arcvue — Board Report · FY2026
Board
CEO / CFO
COO
CGO
Directors
FY26 Revenue
$35.4M
↑ 8.2% vs FY25
Adj. EBITDA
$5.7M
16.1% margin
CovenantValueThresholdStatus
DSCR1.48x≥ 1.20x● Compliant
Leverage4.44x≤ 3.50x⚠ Monitor
Auto-delivered on close · Feb 28, 2026 · 06:22 AM
4 recipients
Contract Waterfall

What investment bankers spend weeks building—generated from your live data.

The contract waterfall is the foundational exhibit for any serious conversation about a GovCon business—with a board, a lender, a buyer, or a PE sponsor. Producing it normally requires weeks of work with your investment banker or months of preparation before a process. Arcvue generates it automatically from your live contract data, every time you need it, always current.

The waterfall decomposes your revenue forecast across the full horizon into three buckets: active contracts projecting forward from period of performance and funded value, recompetes approaching end date tracked with timeline and probability, and new growth required to hit your targets sourced directly from the pipeline module. Each bucket is broken out year by year by division so the shape of the business—how much is locked in, how much depends on retention, how much depends on new wins—is visible at a glance.

This is the exhibit that tells the story behind the revenue number. A firm with five years of active backlog has a different risk profile than one whose plan is 60% dependent on new awards. A division with 15:1 pipeline coverage on its growth target reads differently than one at 2:1. The waterfall makes those distinctions visible and defensible—to a board reviewing the growth plan, a lender assessing cash flow stability, or a buyer evaluating revenue quality in diligence.

The entire waterfall exports to Excel with one click—formatted, labeled, and ready for use in a board deck, a lender presentation, or a data room. The format is the investment banking standard that everyone on the other side of the table already knows how to read. You're not teaching anyone a new exhibit. You're delivering the one they expected, produced from your actual data.

  • Revenue decomposed into active contracts, recompetes, and new growth—year by year, division by division
  • Active contract projections from actual period of performance and funded value—not estimates
  • New growth tied directly to pipeline opportunities—every growth assumption links to a specific pursuit
  • Pipeline coverage ratios by division and year—unweighted, because every GovCon bid is binary
  • Exports to Excel in investment banking standard format—ready for board decks, lender presentations, and data rooms
  • Always current—generated from live data, not a model maintained separately from the ERP
Arcvue — Contract Waterfall
CategoryFY26FY27FY28FY29
● Active Contracts$28.4M$22.1M$16.8M$9.2M
● Recompetes$2.8M$7.4M$9.2M$14.1M
● New Growth$4.2M$8.8M$14.1M$18.7M
Total$35.4M$38.3M$40.1M$42.0M
Coverage (div.)FY26FY27FY28FY29
Federal Health4.2:13.8:12.9:12.3:1
Defense & Intel8.7:119.4:118.7:114.8:1
Export PDF
Export Excel →
Close Review

Assisted sign-off on your monthly close—not just a gut check.

When your controller or bookkeeper sends over the monthly financials, the typical review is directional: does revenue look right, do expenses feel reasonable, are there any obvious anomalies? Arcvue runs a structured set of checks before you sign off—so the review is systematic, not just intuitive.

The close review tab runs automatically when new actuals land from the ERP sync. It checks the newly closed period against prior periods, against budget, against the same month last year, and against the forward forecast. Variances above configurable thresholds are flagged with the specific account, the amount, and the percentage deviation. Covenant headroom is recomputed against the new actuals so you know immediately whether a month that looked fine on revenue had a cost outcome that moves the leverage needle.

The checks go beyond variance analysis. Indirect rate movement is flagged when a pool shifts materially—because a fringe rate that moved 2 points this month is worth understanding before it flows into next quarter's pricing. Balance sheet items that moved unexpectedly—a large AR balance that appeared, a liability that wasn't there last month—are surfaced for review. The system doesn't tell you these things are wrong. It tells you they changed materially, and gives you a clear view of each item so the sign-off is informed, not assumed.

The output is a structured close review checklist—items reviewed, items flagged, items cleared with a note—that becomes the documentation of the review process itself. For firms with boards, PE sponsors, or lender covenants that require management sign-off on monthly financials, the checklist is the evidence that the review happened and was substantive, not just that someone glanced at a P&L and nodded.

  • Automated checks when new actuals land—variance vs prior period, budget, prior year, and forward forecast
  • Covenant headroom recomputed on close—know immediately if the month moved your leverage or DSCR position
  • Indirect rate movement flagged when a pool shifts materially—catch it before it flows into pricing
  • Unexpected balance sheet movements surfaced—large AR appearances, new liabilities, unusual account changes
  • Structured checklist output—reviewed, flagged, cleared with notes—documentation of a substantive review process
  • Configurable variance thresholds—set the sensitivity appropriate for your business size and reporting obligations
Arcvue — Close Review · February 2026
Items Reviewed
24
Flagged
3
Cleared
21
CheckActualExpectedStatus
Revenue vs prior month$2.81M±10%● Clear
G&A rate movement13.2%12.8%⚠ +0.4pts
AR balance change$1.84M$1.20M⚠ +$640K
DSCR post-close1.48x≥1.20x● Compliant
Audit Export Package

Your auditor's PBC list—generated from live data, not assembled by hand.

Every audit and every diligence process starts with the same request: a prepared-by-client document list covering trial balance, revenue summary, AR and AP aging, indirect cost pools, debt schedule, and a dozen other items your team spends weeks pulling together. Arcvue generates the workbook on demand from your live ERP data. The preparation that used to take three weeks takes one click.

The export produces a 19-tab Excel workbook. Trial balance with every account, debit, credit, and net balance. Revenue summary by contract with funded value, ITD revenue, and period of performance. AR aging with invoice-level detail bucketed by days outstanding. AP aging with subcontractor payables tracked separately from general AP. Indirect cost pool breakdown showing pool composition, computed rates, and GL reconciliation—the exhibit that takes longest to prepare manually and matters most for a DCAA-aware audit. GL detail for revenue and direct labor accounts. Subcontractor payable schedule. Debt covenant calculations showing DSCR and leverage against actual credit agreement thresholds. Debt amortization schedule by instrument. Chart of accounts from your actual ERP classification.

Items Arcvue can fully populate from ERP data are marked complete and delivered ready for the auditor. Items that require data from external systems—payroll registers, bank statements, incorporation documents—are pre-built with the correct format and flagged in amber so your team knows exactly what to fill in and what the auditor expects. Manual-only items include source instructions. The workbook arrives on the auditor's desk already 70% complete. The remaining 30% is clearly labeled with exactly what's needed and where to get it.

For firms preparing for a transaction—sale process, refinancing, or new credit facility—the same workbook covers the financial diligence request list. Buyers and lenders ask for the same underlying documents auditors ask for. Having a current, organized, ERP-sourced version of every item available on demand shortens diligence timelines, reduces the back-and-forth over missing or inconsistent data, and signals to the counterparty that the company is run with institutional-grade financial discipline.

  • 19-tab PBC workbook generated on demand—one click, ready for your auditor or diligence team
  • Trial balance, revenue summary, AR/AP aging, indirect pools, debt covenants, debt amortization—all from live ERP data
  • Indirect cost pool breakdown with pool composition, computed rates, and GL reconciliation—the exhibit that matters most for DCAA
  • Partial items pre-populated with Arcvue data—amber-flagged with exactly what to add and where to get it
  • Manual-only items pre-formatted with source instructions—no blank templates, no reformatting required
  • Covers both audit PBC and transaction diligence requests—the same underlying documents, on demand, always current
  • Signals institutional-grade financial discipline to auditors, buyers, and lenders—because the data room is always ready
Arcvue — Audit Export Package
COMPLETE
Trial Balance — 333 accounts
COMPLETE
Revenue Summary — 60 contracts
COMPLETE
AR Aging — 54 invoices
COMPLETE
Indirect Cost Pools + Rates
PARTIAL
Fixed Asset Rollforward
MANUAL
Payroll Registers — see instructions
19 tabs · FY2024 · Generated on demand
82,762 bytes · From live ERP data
Download →
See it in context

Find your use case →

Every capability exists to solve a specific problem. Find yours and see how the platform addresses it end to end.

Explore Use Cases

Reports and documents that build themselves.

Connect your ERP and walk through a live demo. See your board package, your audit workbook, your covenant package—all generated from your actual data.

Try the Demo